Table of contents
- 2024 was advertising’s first trillion-dollar year
- 2025 will be another massive year for mobile
- ATT opt-in rates
- Cost per install: global
- Regional CPI, CTR, CVR: top countries
- Ad networks & platforms: top gainers
- Ad spend growth and decrease by country
- Hottest genres with the most downloads: global
- Key metrics by vertical
- Platform ad spend share: iOS, Android, web
- Paid vs organic installs
- Partner contributions

Available in: English, Portuguese and Spanish
2024 was advertising’s first trillion-dollar year
Welcome to Singular’s Q1 2025 quarterly report!
Global ad spend surpassed the trillion-dollar mark for the first time ever in 2024, thanks to a 10.5% growth rate, according to WARC. That’s both the strongest growth in 6 years and the largest increase in absolute dollar value ever — $104B in incremental advertising spend worldwide — if we disregard the 2021 post-Covid recovery.
So yeah: marketers are competing in a super-heated ecosystem.
And just to turn up that thermostat even more, Q4 was the hottest part of the hottest year on record, with 30% of the year’s ad spend: a staggering $324 billion.
But we know that a good chunk of that holiday quarter spending is not traditional user acquisition. It’s retail and shopping: gifts and personal indulgences. User acquisition is a little different: it tends to be smarter spend. And that means many mobile growth experts spend in Q2 and Q3 when it’s cheaper, and ease back on the throttle in Q4 when prices jump.
So while UA spend was up massively in 2024 overall, Q4 was down 24.5% compared to Q3. We’ll see that jump all back up again in Q1, and likely peak in Q2 and Q3.
2025 will be another massive year for mobile
2024 was huge. 2025 is set to be another massive year for mobile marketers.
Competition and anti-trust authorities all over the world are cracking open the App Store and Google Play. New channels like CTV, podcasting, retail media, and (yes) even social media are seeing the largest percentage increases in spend. Rewarded/incentivized ad networks are growing fast. The winds of change are in the air.
Here’s what we’re seeing in the data. Scroll through this report for more details:
- Hello ChatGPT: custom and organic sources like ChatGPT skyrocketed
- Web spend jumped massively in Q4 at the expense of iOS and Android
- In fact, from January to December, web ad spend jumped 54.39% (!!)
- CPIs jumped 60% for apps (as opposed to games)
- IPMs cratered (installs per thousand ad views)
- ATT opt-ins stayed relatively high
- Small ad networks gained both the most growth and the most new advertisers
- Casual game players are 3-4X more valuable to advertisers than Hyper casual players
- CTR was up for games but sharply down for apps
In addition, we have new insights from data partners on this report:
- SplitMetrics
Apple Search Ads TTR, CPT, new regions - AVOW
Dynamic Preloads for huge growth and organic uplift - Kayzen
Programmatic for full-screen ads - Rocketship HQ
AI in creative
As always, data in this report is based on a significant slice of Singular’s data:
ATT opt-in rates
Overall ATT opt-in
The first half of 2024 was bad for ATT opt-in rates: in Q2 the ATT yes rate dropped to 13.85%: a historically low opt-in rate. But the second half of 2024 was much better for iOS measurement via IDFA.
In Q3 the yes rate jumped to 16.35%, near a high-water mark.
And in Q4 it stayed fairly high despite a small drop: 15.68%.
Remember, IDFA is a double-verify system: people have to opt in on both the advertised app and advertising app.
So in practical terms what this means is that if your app is dead average, about 4% of your installs potentially have full IDFA visibility. So if you drive 250,000 installs via an ad partner, 10,000 of them have IDFA. That’s enough to pay attention to and get a good read on your overall population of new users.
Important note:
This is based on apps that ask for ATT permission immediately upon download. It’s important to remember that the rate can and does grow. Many apps do not request tracking permission immediately, so the percentage generally grows over time.
So the 4% is a low-water mark in most cases.
ATT opt-in: gaming vs non-gaming
The gap between games and apps for initial ATT ask-and-accept is still large. For whatever reason, people are still much more likely to say yes to ATT in games than in apps.
- In Q4 2023, the gap was just 1%
- In Q1 2024, the gap grew to 4.1%
- In Q2 2024, the gap expanded again to 6.67%
- In Q3 2024, the gap stayed basically level at 6.66%
- In Q4 2024, the gap shrank a bit to 4.63%
The interesting part?
The main reason the gap shrunk in Q4 of 2024 is that games achieved lower YES rates.
19.03% of games that asked for ATT permission upon download got a yes, down from 10.25% in the previous quarter, while only 14.4% of apps did, essentially flat with the previous quarter’s 14.64%.
ATT opt-in by gaming verticals
Some games are just ridiculously high in ATT acceptance. Adventure games are again over 25%, along with Card and Simulation games.
Hypercasual games in general were higher this quarter than last at 16.4%, but Casual games are much higher at almost 23% yes.
ATT opt-in by non-gaming verticals
Maps & Navigation is now the highest non-gaming vertical in terms of ATT acceptance, while Food & Drink has fallen below 30%.
Travel and Finance are high, while Shopping (retail) is middle of the pack.
Business, News & Magazine, and Social apps are low, as are Medical apps. Health & Fitness apps are also below average.
ATT double opt-in
App Tracking Transparency requires double opt-in: a yes on the publisher app that is displaying an ad, and a yes on the advertiser app that the ad is for. This is why you need a high ATT “yes” rate.

Note:
If you’re way above average and getting 40% on both sides, 16% of your installs are now trackable. That’s small, but at scale it’s a significant percentage which you can use as modeling guidance for your overall ad spend and optimization.
Even 10% could be enough, or 5% with sufficient volume.
Cost per install: global
CPIs were up in Q4, as you’d expect in a busy holiday quarter.
Games were impacted the least, seeing between 15-26% increases, while apps were impacted the most: over 60% up.
What’s happening?
- Non-gaming apps are likely to advertise outside of games, which is also where retail/shopping ads are most likely to show up
- Gaming apps are likely to advertise in games, which are less impacted by the holiday quarter retail ad surge because to date, retailers don’t advertise in games nearly as much
- U.S. election spending ramped up in Q4 with total spending as high as $16 billion
Note: the first 2 trends could change in the (near) future.
Android games
- Global CPI: $0.75 ⬆️ $0.10
- Global CTR: 3.93% ⬇️ .2 percentage points
- Global IPM: 4.93 ⬇️ .46
As you’d expect in the holiday quarter, cost per install was up while both click-through rate and installs per thousand ads shown were down. Holiday quarters typically see more spend, higher ad load, and busier people.
Casino games are up almost $1 per install and remain the most costly games to buy installs for. Card games are up over $2 per install: a massive jump from Q3 2024. After that, everything gets significantly cheaper.
Of note:
- Hyper casual games: $0.21 per install
- Casual games: $0.61 per install
Clearly, the market values Casual game players at about 3X higher than Hyper casual.
Android non-gaming
- Global CPI: $0.88 ⬆️ $0.36
- Global CTR: 2.61% ⬇️ .131 percentage points
- Global IPM: 3.13 ⬇️ 1.55
There was a similar but more dramatic story for Android apps in Q4. CPI was way up, while CTR trended slightly down. But IPM cratered in Q4 with its steepest drop in over a year, and .83 installs per thousand ads shown lower than 2023’s Q4.
That’s a 33% drop quarter over quarter, and a 21% drop year over year.
Sports and Finance apps continue to lead the cost per install rankings for Android apps, but Food & Drink dropped to seventh from third. Shopping stayed in fourth place, but prices did jump more than 50% … as you would expect in the biggest retail quarter of the year.
Note for 2025:
If you’re in retail or shopping, schedule significant user acquisition campaigns for Q3 or even Q2, coupled with an engagement and retention plan to activate users in Q4. You’ll save considerably on CAC.
iOS games
- Global CPI: $3.36 ⬆️ $0.69
- Global CTR: 5.29% ⬆️ .46 percentage points
- Global IPM: 0.73 ⬇️ .12
Cost per install jumped over half a dollar in Q4 2024, and click-through rates went up as well, though installs per thousand ads show dropped slightly.
As usual, iOS users are more adblind than Android users, with significantly lower IPMs.
Price per install got a little crazy for Card games, which took the top spot in Q4, as they did in Q3. We’re talking over $13 per install, almost double the next category of games, Family. CPI for Card games is so high I did some double-checking, and it’s not just an outlier: there are about 400 million clicks and millions of installs in the data slice we analyzed.
As usual Trivia and Racing are the cheapest installs to buy, with Casino and Board games in the midrange.
Of note:
- Hyper casual games: $1.18
- Casual games: $4.09
On iOS, publishers value Casual game players almost 4X more than Hyper casual players.
iOS non-gaming
- Global CPI: $1.13 ⬆️ $0.44
- Global CTR: 2.87% ⬇️ .39 percentage points
- Global IPM: 2.87 ⬇️ 1.43
Global iOS CPI for apps jumped 64% in Q4 of 2024 after 2 consecutive quarters of slight drops. CTR was just slightly down, but IPM dropped 33%.
It’s Q4: lots of ads, higher prices, and tougher results.
Finance apps leapt to the top of the CPI leaderboard in Q4 at almost $9 per install. Entertainment and Sports were the other 2 relatively expensive genres.
News and magazines dropped significantly, while Productivity apps were almost $1 more expensive to get in Q4 than they were in Q3.
Regional CPI, CTR, CVR: top countries
| Country | CPI | CVR | CTR |
|---|---|---|---|
| Afghanistan | $0.02 | 36.55% | 4.26% |
| Åland Islands | $0.06 | 54.38% | 7.72% |
| Albania | $0.06 | 25.94% | 6.44% |
| Algeria | $0.01 | 44.92% | 4.39% |
| American Samoa | $0.28 | 32.85% | 1.61% |
| Andorra | $0.06 | 54.13% | 4.90% |
| Angola | $0.03 | 67.18% | 4.16% |
| Anguilla | $0.05 | 48.76% | 3.49% |
| Antarctica | $0.18 | 106.82% | 0.97% |
| Antigua and Barbuda | $0.07 | 54.77% | 3.41% |
| Argentina | $0.15 | 23.88% | 1.81% |
| Armenia | $0.04 | 34.83% | 5.05% |
| Aruba | $0.07 | 39.09% | 4.70% |
| Australia | $0.88 | 32.67% | 2.57% |
| Austria | $0.64 | 24.50% | 2.10% |
| Azerbaijan | $0.03 | 39.15% | 4.97% |
| Bahamas (the) | $0.10 | 35.90% | 5.62% |
| Bahrain | $0.10 | 42.14% | 3.62% |
| Bangladesh | $0.01 | 30.69% | 4.91% |
| Barbados | $0.05 | 42.67% | 5.32% |
| Belarus | $0.04 | 30.62% | 5.53% |
| Belgium | $0.55 | 26.02% | 2.62% |
| Belize | $0.03 | 50.28% | 3.68% |
| Benin | $0.05 | 64.14% | 3.56% |
| Bermuda | $0.13 | 43.59% | 3.75% |
| Bhutan | $0.03 | 37.92% | 2.42% |
| Bolivia (Plurinational State of) | $0.02 | 29.29% | 5.61% |
| Bonaire, Sint Eustatius and Saba | $0.06 | 53.83% | 3.19% |
| Bosnia and Herzegovina | $0.06 | 38.71% | 3.62% |
| Botswana | $0.04 | 56.33% | 4.20% |
| Brazil | $0.16 | 32.88% | 2.38% |
| British Indian Ocean Territory (the) | $0.03 | 93.28% | 2.69% |
| Brunei Darussalam | $0.05 | 32.51% | 5.10% |
| Bulgaria | $0.17 | 26.23% | 3.81% |
| Burkina Faso | $13.40 | 19.56% | 4.38% |
| Burundi | $0.04 | 43.93% | 3.51% |
| Cabo Verde | $0.04 | 53.60% | 2.21% |
| Cambodia | $0.03 | 37.61% | 3.77% |
| Cameroon | $0.04 | 66.08% | 3.36% |
| Canada | $1.18 | 26.13% | 2.07% |
| Cayman Islands (the) | $0.08 | 59.50% | 4.22% |
| Central African Republic (the) | $0.04 | 50.64% | 3.19% |
| Chad | $0.05 | 38.88% | 4.12% |
| Chile | $0.25 | 34.31% | 1.41% |
| China | $0.01 | 10.26% | 186.84% |
| Christmas Island | $0.03 | 28.72% | 2.77% |
| Cocos (Keeling) Islands (the) | $0.03 | 125.00% | 1.54% |
| Colombia | $0.10 | 37.10% | 2.21% |
| Comoros (the) | $0.03 | 50.30% | 2.61% |
| Congo (the Democratic Republic of the) | $0.03 | 55.98% | 4.27% |
| Congo (the) | $0.02 | 69.30% | 3.81% |
| Cook Islands (the) | $0.16 | 28.30% | 3.38% |
| Costa Rica | $0.08 | 46.69% | 2.84% |
| Côte d’Ivoire | $0.03 | 90.59% | 3.98% |
| Croatia | $0.22 | 29.59% | 3.20% |
| Cuba | $0.00 | 484.86% | 3.13% |
| Curaçao | $0.05 | 48.59% | 4.05% |
| Cyprus | $0.21 | 33.92% | 2.64% |
| Czechia | $0.28 | 23.65% | 2.77% |
| Denmark | $0.85 | 17.23% | 2.36% |
| Djibouti | $0.03 | 58.01% | 4.23% |
| Dominica | $0.05 | 49.72% | 3.84% |
| Dominican Republic (the) | $0.05 | 38.65% | 3.78% |
| Ecuador | $0.05 | 49.62% | 3.56% |
| Egypt | $0.03 | 45.56% | 3.99% |
| El Salvador | $0.05 | 50.30% | 4.02% |
| Equatorial Guinea | $0.03 | 43.89% | 3.77% |
| Eritrea | $0.08 | 32.64% | 3.34% |
| Estonia | $0.13 | 34.64% | 3.07% |
| Eswatini | $0.04 | 48.76% | 3.38% |
| Ethiopia | $0.04 | 47.53% | 3.84% |
| Falkland Islands (the) [Malvinas] | $0.16 | 46.00% | 2.22% |
| Faroe Islands (the) | $0.15 | 33.59% | 3.10% |
| Fiji | $0.06 | 37.52% | 3.94% |
| Finland | $0.53 | 26.13% | 2.06% |
| France | $0.90 | 22.05% | 1.66% |
| French Guiana | $0.07 | 60.21% | 2.91% |
| French Polynesia | $0.10 | 43.30% | 4.15% |
| French Southern Territories (the) | $0.07 | 250.00% | 0.59% |
| Gabon | $0.02 | 67.96% | 4.02% |
| Gambia (the) | $0.03 | 54.59% | 4.03% |
| Georgia | $0.06 | 29.36% | 4.72% |
| Germany | $0.75 | 27.13% | 2.11% |
| Ghana | $3.66 | 20.13% | 4.52% |
| Gibraltar | $0.09 | 53.03% | 3.40% |
| Greece | $0.41 | 20.11% | 2.19% |
| Greenland | $0.14 | 32.00% | 1.85% |
| Grenada | $0.06 | 40.44% | 4.12% |
| Guadeloupe | $0.08 | 61.18% | 3.19% |
| Guam | $0.31 | 24.87% | 2.88% |
| Guatemala | $0.04 | 43.95% | 3.84% |
| Guernsey | $0.15 | 35.56% | 4.27% |
| Guinea | $0.03 | 58.15% | 3.36% |
| Guinea-Bissau | $0.04 | 41.40% | 3.79% |
| Guyana | $0.03 | 41.22% | 4.26% |
| Haiti | $0.02 | 59.28% | 3.61% |
| Holy See (the) | $0.08 | 169.91% | 3.41% |
| Honduras | $0.03 | 47.74% | 4.14% |
| Hong Kong | $0.21 | 79.12% | 1.60% |
| Hungary | $0.28 | 24.45% | 2.69% |
| Iceland | $0.22 | 25.16% | 5.90% |
| India | $0.10 | 29.09% | 1.78% |
| Indonesia | $0.05 | 32.48% | 3.06% |
| Iran (Islamic Republic of) | $0.00 | 327.59% | 2.34% |
| Iraq | $0.49 | 29.19% | 6.51% |
| Ireland | $0.85 | 30.97% | 1.87% |
| Isle of Man | $0.11 | 31.91% | 4.96% |
| Israel | $0.22 | 30.44% | 3.86% |
| Italy | $0.63 | 21.03% | 1.89% |
| Jamaica | $0.09 | 34.68% | 3.95% |
| Japan | $0.24 | 63.55% | 1.85% |
| Jersey | $0.12 | 41.31% | 4.64% |
| Jordan | $0.27 | 29.28% | 3.59% |
| Kazakhstan | $0.04 | 34.92% | 4.87% |
| Kenya | $0.07 | 50.96% | 2.47% |
| Kiribati | $0.26 | 15.19% | 1.35% |
| Korea (the Republic of) | $0.77 | 19.22% | 1.98% |
| Kuwait | $0.17 | 28.65% | 3.53% |
| Kyrgyzstan | $0.02 | 32.22% | 7.54% |
| Lao People’s Democratic Republic (the) | $0.01 | 52.71% | 4.48% |
| Latvia | $0.14 | 24.80% | 4.24% |
| Lebanon | $0.03 | 29.84% | 5.32% |
| Lesotho | $0.04 | 60.95% | 3.20% |
| Liberia | $0.04 | 48.29% | 3.59% |
| Libya | $0.02 | 41.00% | 4.14% |
| Liechtenstein | $0.12 | 41.77% | 3.86% |
| Lithuania | $0.13 | 29.64% | 4.15% |
| Luxembourg | $0.28 | 26.86% | 4.02% |
| Macao | $0.14 | 37.45% | 5.17% |
| Madagascar | $0.03 | 63.10% | 3.33% |
| Malawi | $0.04 | 41.26% | 4.06% |
| Malaysia | $0.17 | 18.02% | 2.64% |
| Maldives | $0.04 | 36.12% | 4.01% |
| Mali | $0.03 | 40.36% | 5.23% |
| Malta | $0.16 | 36.59% | 3.71% |
| Marshall Islands (the) | $0.08 | 32.66% | 2.24% |
| Martinique | $0.08 | 42.79% | 3.87% |
| Mauritania | $0.02 | 60.04% | 4.11% |
| Mauritius | $0.04 | 50.66% | 4.29% |
| Mayotte | $0.06 | 45.83% | 2.88% |
| Mexico | $0.36 | 21.26% | 1.54% |
| Micronesia (Federated States of) | $0.06 | 31.66% | 2.88% |
| Moldova (the Republic of) | $0.06 | 33.11% | 4.45% |
| Monaco | $0.10 | 58.49% | 8.91% |
| Mongolia | $0.03 | 38.67% | 4.50% |
| Montenegro | $0.06 | 33.97% | 4.68% |
| Montserrat | $0.10 | 45.53% | 3.03% |
| Morocco | $0.58 | 27.88% | 5.42% |
| Mozambique | $0.04 | 55.31% | 4.61% |
| Myanmar | $0.02 | 59.89% | 2.92% |
| Namibia | $0.64 | 67.25% | 3.93% |
| Nauru | $0.46 | 19.80% | 1.39% |
| Nepal | $0.01 | 41.83% | 3.87% |
| Netherlands (the) | $0.91 | 23.22% | 2.49% |
| New Caledonia | $0.08 | 40.51% | 3.93% |
| New Zealand | $0.78 | 32.62% | 2.16% |
| Nicaragua | $0.02 | 47.37% | 4.38% |
| Niger (the) | $0.02 | 53.80% | 4.28% |
| Nigeria | $0.11 | 41.97% | 1.38% |
| Niue | $0.80 | 13.30% | 1.66% |
| Norfolk Island | $0.35 | 22.18% | 2.45% |
| Northern Mariana Islands (the) | $0.18 | 46.37% | 2.15% |
| Norway | $0.51 | 21.60% | 2.53% |
| Oman | $0.07 | 43.21% | 3.13% |
| Pakistan | $0.02 | 34.71% | 3.53% |
| Palau | $0.09 | 32.74% | 2.91% |
| Palestine, State of | $0.02 | 36.44% | 5.96% |
| Panama | $0.05 | 46.19% | 3.82% |
| Papua New Guinea | $0.08 | 45.06% | 3.68% |
| Paraguay | $0.03 | 41.12% | 4.71% |
| Peru | $0.11 | 36.99% | 2.39% |
| Philippines (the) | $0.09 | 26.89% | 2.36% |
| Pitcairn | $0.07 | 42.11% | 4.13% |
| Poland | $0.32 | 33.55% | 2.02% |
| Portugal | $0.43 | 29.02% | 1.64% |
| Puerto Rico | $0.23 | 28.89% | 3.16% |
| Qatar | $0.14 | 42.01% | 2.90% |
| Republic of North Macedonia | $0.05 | 32.68% | 5.26% |
| Réunion | $0.07 | 51.01% | 3.60% |
| Romania | $0.19 | 25.86% | 2.84% |
| Russian Federation (the) | $0.05 | 28.12% | 9.13% |
| Rwanda | $0.04 | 49.26% | 4.30% |
| Saint Barthélemy | $0.18 | 58.33% | 1.54% |
| Saint Helena, Ascension and Tristan da Cunha | $0.08 | 44.51% | 1.41% |
| Saint Kitts and Nevis | $0.07 | 45.09% | 3.59% |
| Saint Lucia | $0.05 | 49.02% | 4.29% |
| Saint Martin (French part) | $0.10 | 38.19% | 2.13% |
| Saint Pierre and Miquelon | $0.12 | 31.90% | 1.77% |
| Saint Vincent and the Grenadines | $0.04 | 50.41% | 3.64% |
| Samoa | $0.04 | 34.22% | 2.99% |
| San Marino | $0.08 | 44.90% | 3.97% |
| Sao Tome and Principe | $0.02 | 61.10% | 3.01% |
| Saudi Arabia | $0.17 | 24.55% | 3.14% |
| Senegal | $0.02 | 74.68% | 3.74% |
| Serbia | $0.07 | 30.46% | 3.84% |
| Seychelles | $0.03 | 75.74% | 5.38% |
| Sierra Leone | $0.03 | 47.59% | 4.29% |
| Singapore | $0.27 | 49.78% | 2.86% |
| Sint Maarten (Dutch part) | $0.07 | 42.28% | 3.25% |
| Slovakia | $0.23 | 28.44% | 2.68% |
| Slovenia | $0.30 | 31.65% | 2.83% |
| Solomon Islands | $0.05 | 31.48% | 3.18% |
| Somalia | $0.02 | 49.42% | 4.86% |
| South Africa | $0.61 | 25.37% | 1.74% |
| South Sudan | $0.05 | 36.81% | 3.21% |
| Spain | $0.87 | 21.24% | 1.48% |
| Sri Lanka | $0.05 | 41.97% | 1.60% |
| Sudan (the) | $0.01 | 65.65% | 3.77% |
| Suriname | $0.03 | 41.38% | 4.47% |
| Svalbard and Jan Mayen | $2.09 | 8.15% | 0.76% |
| Sweden | $0.44 | 19.26% | 3.52% |
| Switzerland | $0.60 | 30.89% | 2.43% |
| Syrian Arab Republic | $0.00 | 737.02% | 1.91% |
| Taiwan (Province of China) | $0.78 | 19.59% | 1.60% |
| Tajikistan | $0.01 | 38.10% | 6.60% |
| Tanzania, United Republic of | $0.03 | 53.35% | 3.13% |
| Thailand | $0.17 | 25.81% | 2.49% |
| Timor-Leste | $0.02 | 50.99% | 2.91% |
| Togo | $0.03 | 63.96% | 4.09% |
| Tokelau | $0.03 | 123.40% | 1.87% |
| Tonga | $0.08 | 37.48% | 1.92% |
| Trinidad and Tobago | $0.04 | 46.99% | 4.53% |
| Tunisia | $0.02 | 56.16% | 3.44% |
| Turkey | $0.09 | 26.69% | 3.23% |
| Turkmenistan | $0.00 | 107.19% | 4.13% |
| Turks and Caicos Islands (the) | $0.08 | 57.33% | 2.65% |
| Tuvalu | $0.47 | 19.56% | 0.61% |
| Uganda | $0.03 | 63.92% | 3.85% |
| Ukraine | $0.07 | 28.85% | 4.54% |
| United Arab Emirates (the) | $0.24 | 38.87% | 3.02% |
| United Kingdom of Great Britain and Northern Ireland (the) | $1.02 | 26.55% | 2.01% |
| United States of America (the) | $1.48 | 8.12% | 7.59% |
| Uruguay | $0.08 | 37.51% | 3.90% |
| Uzbekistan | $0.02 | 39.68% | 6.84% |
| Vanuatu | $0.08 | 19.87% | 5.02% |
| Venezuela (Bolivarian Republic of) | $0.03 | 29.54% | 4.77% |
| Viet Nam | $0.05 | 27.01% | 3.57% |
| Virgin Islands (British) | $0.11 | 37.04% | 3.27% |
| Virgin Islands (U.S.) | $0.21 | 36.35% | 3.19% |
| Wallis and Futuna | $0.11 | 24.94% | 2.46% |
| Western Sahara | $4.64 | 0.53% | 2.85% |
| Yemen | $0.02 | 30.38% | 5.65% |
| Zambia | $0.03 | 72.22% | 3.36% |
| Zimbabwe | $0.03 | 74.41% | 3.90% |
Ad networks & platforms: top gainers
Gained the most ad spend: percentage
Clearly it’s easier for smaller players to gain higher rates of growth. But the big players always get their time in the sun, so here’s to the emerging challengers.
- Ocean Media
- StreamElements
- MediaSmart
- 360 Search (so.com)
- Unity CTV (note: this is a subset of Unity Ads)
- TaurusX
- Swagbucks
- StackAdapt
- Digital Turbine
- Remerge
- ROKT
Gained the most advertisers
These ad networks gained the most new advertisers from Q3 to Q4. Reddit is on the ascendancy, as are AppLovin and Moloco. And Mintegral leads the list for most new advertisers gained.
- Mintegral
- AppLovin
- Moloco
- Almedia
- Exmox
- Motive Interactive
- YouTube
- Blitz Ads
- StreamElements
- Prodege
- RevU
- Unity Ads
Other big gainers: custom sources
There are some big gainers in advertisers that are not traditional ad networks, but custom sources:
- Custom source (various)
- ChatGPT
- Newsletter
- Telegram
- Display (Custom)
- Influencers (Custom)
- Search (Custom)
The big story: ChatGPT has arrived on the ad network scene.
Also, custom integrations with owned and partnered sources, including influencers, custom search arrangements, custom display sponsorships, and Telegram indicates that marketers are getting more creative in terms of channels and platforms.
Ad spend growth and decrease by country
Spend measured by Singular dropped in Q4, largely because performance marketers in mobile tend to spend in anticipation of the holiday fourth quarter. That helps them avoid the high ad prices that the flood of Q4 brand and retail advertising can cause.
(Example: CPIs were up from 15.4% to 69.2% in Q4. Apps in particular were much more expensive.)
The result is the top gaining countries in Q4 are not your usual suspects, because Q4 is not a “holiday quarter” for all countries.
Here are the top ad spend gainers, listed by absolute dollars spent increase. And while those in the West might look at the nations and think there’s not much going on here, all countries are in the multiples of millions of dollars of spend at minimum.
- Ghana
- Iraq
- Burkina Faso
- Morocco
- South Africa
- Spain
- Denmark
- Ireland
- Poland
Here are the countries that lost the most ad spend:
- United States
- Japan
- UK
- Germany
- Canada
- Australia
- France
- Korea
- Mexico
- India
Hottest genres with the most downloads: global
Android games
Casual games reclaimed the lead as the most popular genre in late 2024, with Hyper casual games falling to their lowest level as a percentage of all games downloaded since Q1.
Hyper casual games as a percentage of all game downloads on Android:
- Q4 2023: 36%
- Q1 2024: 21%
- Q2 2024: 24%
- Q3 2024: 26%
- Q4 2024: 21%
Casual games hit 24.76% of all installs measured by Singular for Android games, with Simulation, Puzzle, and Action taking the next few slots.
Android non-gaming
Entertainment continues to be the top genre for Android apps, growing even more in the holiday quarter. Social got hot as the competition between Bluesky, Mastodon, and Threads to be the next Twitter accelerated.
Q4 saw even more consolidation, as the top 5 categories of Entertainment, Lifestyle, Social, Business, and Food & Drink took up about 75% of all app installs outside of games on Android. The previous quarter, the top 5 only sucked up 60% of all installs.
Note: Travel fell out of the top 5 and all the way to #12 in Q4: perhaps people needed travel apps to book in Q3 for Q4, or Travel publishers pushed hard in Q3 to get customers for Q4.
iOS games
Hyper casual is back! Well, on iOS, and at least for 1 quarter. For the first time in 3 quarters, Hyper casual games surpassed Casual games as the category leader on iOS. And it’s a big reversal: last quarter Casual games had almost 30% more installs than Hyper casual.
Action games dropped from fourth to eight in the quarter as well.
iOS: non-gaming
Hello Q4, bye-bye Music & Audio. Also bye-bye Entertainment. Those 2 top cateogires from the previous quarter were unceremoniously dumped by Food & Drink as well as Lifestyle, which shot up the rankings and captured 57% of all non-game downloads in Q4 on iOS.
The previous quarter?
Lifestyle was #3; Food & Drink was #7.
Key metrics by vertical
Click-through rates: games
CTR was up for games across the board in Q4 2024, though it was sharply down for apps. Average CTR for Android games was up slightly from Q4 and up 3% year-over-year.
Racing, Trivia, and Hyper casual led the way:
CTR was up 21% year-over-year for iOS games, hitting an average of 5.29%. Puzzle games led the way again, but were up even higher than last quarter.
Click-through rates: apps
CTRs cratered for apps on both Android and IOS in Q4 2024, down 18% on Android and 19% on iOS. Key drivers here include ad congestion in the holiday quarter as well as the election cycle in the U.S.
Overall CTR for Android apps was 2.61%.
On iOS, the CTR across all apps was 2.87%, still higher than Android, but down significantly.
The highest-performing verticals include Entertainment, Books & Reference, and Photo & Video.
IPM: games
Across the board, IPM (installs per thousand ad views) was down for both Android and iOS games and apps in Q4 2024.
Average IPM for Android games was 4.93 in Q4, with Racing and Trivia games by far in the lead. Casino games, while super lucrative, have the worst IPMs of any Android game genres.
Average IPM on iOS for games is only 15% of what it is on Android, and that’s consistently the case.
Racing leads, by far, followed by Hyper casual and Sports games. Family, Board, and Card are the lowest IPM categories on iOS.
IPM: apps
IPM was down across the board in Q4 of 2024, likely due to holiday quarter busy-ness as well as election advertising in the U.S. Android apps had an average IPM of 3.13, down from 4.68 in the previous quarter, and also down from the year-ago quarter in 2023, which was 3.96.
Business apps led, followed by Art & Design, Travel, and Family apps.
Average IPM for iOS apps was 2.87, down from 4.3 last quarter and 3.93 in the year-ago quarter.
Leaders included Food & Drink and Lifestyle, along with Art & Design and Music & Audio.
Platform ad spend share: iOS, Android, web
Web was way up in Q4 at the expense of both Android and iOS:
| Q3 | Q4 | |
| iOS | 40.12% | 35.54% |
| Android | 36.47% | 34.95% |
| Web | 23.42% | 29.51% |
iOS and Android have both lost share of ad spend, with the iOS loss about 5X the Android loss.
Looking at the web versus mobile ad spend month by month throughout 2024, however, tells a clearer picture:
- Web ad spend grew all year
- In December, web ad spend massively accelerated
In fact, from January to December, web ad spend jumped 54.39%.
Platform spend by country
| Country | Platform | % of Total Cost |
|---|---|---|
| Aruba | iOS | 38.31% |
| Android | 59.91% | |
| Desktop & Web | 1.78% | |
| Afghanistan | iOS | 21.14% |
| Android | 75.84% | |
| Desktop & Web | 3.02% | |
| Angola | iOS | 22.93% |
| Android | 61.74% | |
| Desktop & Web | 15.33% | |
| Anguilla | iOS | 36.30% |
| Android | 61.41% | |
| Desktop & Web | 2.29% | |
| Åland Islands | iOS | 73.94% |
| Android | 26.06% | |
| Desktop & Web | ||
| Albania | iOS | 54.48% |
| Android | 38.24% | |
| Desktop & Web | 7.28% | |
| Andorra | iOS | 77.31% |
| Android | 16.95% | |
| Desktop & Web | 5.74% | |
| United Arab Emirates (the) | iOS | 38.59% |
| Android | 41.30% | |
| Desktop & Web | 20.11% | |
| Argentina | iOS | 11.67% |
| Android | 67.01% | |
| Desktop & Web | 21.32% | |
| Armenia | iOS | 35.26% |
| Android | 58.83% | |
| Desktop & Web | 5.90% | |
| American Samoa | iOS | 68.54% |
| Android | 26.10% | |
| Desktop & Web | 5.36% | |
| Antarctica | iOS | 23.92% |
| Android | 42.91% | |
| Desktop & Web | 33.17% | |
| French Southern Territories (the) | iOS | 37.39% |
| Android | 62.61% | |
| Antigua and Barbuda | iOS | 31.46% |
| Android | 66.94% | |
| Desktop & Web | 1.60% | |
| Australia | iOS | 38.70% |
| Android | 34.19% | |
| Desktop & Web | 27.12% | |
| Austria | iOS | 29.90% |
| Android | 49.60% | |
| Desktop & Web | 20.50% | |
| Azerbaijan | iOS | 24.34% |
| Android | 71.65% | |
| Desktop & Web | 4.01% | |
| Burundi | iOS | 11.89% |
| Android | 74.36% | |
| Desktop & Web | 13.75% | |
| Belgium | iOS | 27.65% |
| Android | 44.62% | |
| Desktop & Web | 27.74% | |
| Benin | iOS | 16.02% |
| Android | 49.05% | |
| Desktop & Web | 34.93% | |
| Bonaire, Sint Eustatius and Saba | iOS | 29.28% |
| Android | 68.66% | |
| Desktop & Web | 2.06% | |
| Burkina Faso | iOS | 6.72% |
| Android | 39.99% | |
| Desktop & Web | 53.29% | |
| Bangladesh | iOS | 6.71% |
| Android | 77.22% | |
| Desktop & Web | 16.07% | |
| Bulgaria | iOS | 24.55% |
| Android | 55.95% | |
| Desktop & Web | 19.51% | |
| Bahrain | iOS | 53.12% |
| Android | 38.89% | |
| Desktop & Web | 7.99% | |
| Bahamas (the) | iOS | 31.30% |
| Android | 67.55% | |
| Desktop & Web | 1.15% | |
| Bosnia and Herzegovina | iOS | 26.64% |
| Android | 67.74% | |
| Desktop & Web | 5.62% | |
| Saint Barthélemy | iOS | 69.38% |
| Android | 23.42% | |
| Desktop & Web | 7.20% | |
| Belarus | iOS | 21.15% |
| Android | 77.92% | |
| Desktop & Web | 0.93% | |
| Belize | iOS | 11.99% |
| Android | 86.81% | |
| Desktop & Web | 1.21% | |
| Bermuda | iOS | 61.55% |
| Android | 35.81% | |
| Desktop & Web | 2.64% | |
| Bolivia (Plurinational State of) | iOS | 10.23% |
| Android | 84.43% | |
| Desktop & Web | 5.34% | |
| Brazil | iOS | 16.24% |
| Android | 62.30% | |
| Desktop & Web | 21.46% | |
| Barbados | iOS | 18.19% |
| Android | 79.64% | |
| Desktop & Web | 2.17% | |
| Brunei Darussalam | iOS | 44.80% |
| Android | 51.63% | |
| Desktop & Web | 3.56% | |
| Bhutan | iOS | 42.52% |
| Android | 52.36% | |
| Desktop & Web | 5.12% | |
| Bouvet Island | Android | |
| Botswana | iOS | 18.02% |
| Android | 66.69% | |
| Desktop & Web | 15.30% | |
| Central African Republic (the) | iOS | 26.17% |
| Android | 62.16% | |
| Desktop & Web | 11.68% | |
| Canada | iOS | 40.53% |
| Android | 33.40% | |
| Desktop & Web | 26.07% | |
| Cocos (Keeling) Islands (the) | iOS | 72.90% |
| Android | 26.59% | |
| Desktop & Web | 0.50% | |
| Switzerland | iOS | 37.68% |
| Android | 39.32% | |
| Desktop & Web | 22.99% | |
| Chile | iOS | 14.29% |
| Android | 55.86% | |
| Desktop & Web | 29.85% | |
| China | iOS | 74.98% |
| Android | 5.43% | |
| Desktop & Web | 19.59% | |
| Côte d’Ivoire | iOS | 31.61% |
| Android | 54.06% | |
| Desktop & Web | 14.33% | |
| Cameroon | iOS | 11.58% |
| Android | 59.97% | |
| Desktop & Web | 28.45% | |
| Congo (the Democratic Republic of the) | iOS | 20.60% |
| Android | 67.37% | |
| Desktop & Web | 12.03% | |
| Congo (the) | iOS | 34.18% |
| Android | 51.22% | |
| Desktop & Web | 14.60% | |
| Cook Islands (the) | iOS | 35.93% |
| Android | 45.63% | |
| Desktop & Web | 18.43% | |
| Colombia | iOS | 17.43% |
| Android | 67.47% | |
| Desktop & Web | 15.10% | |
| Comoros (the) | iOS | 15.96% |
| Android | 70.40% | |
| Desktop & Web | 13.64% | |
| Cabo Verde | iOS | 42.20% |
| Android | 50.78% | |
| Desktop & Web | 7.01% | |
| Costa Rica | iOS | 16.97% |
| Android | 77.35% | |
| Desktop & Web | 5.68% | |
| Cuba | iOS | 3.99% |
| Android | 95.87% | |
| Desktop & Web | 0.14% | |
| Curaçao | iOS | 29.89% |
| Android | 68.30% | |
| Desktop & Web | 1.81% | |
| Christmas Island | iOS | 1.68% |
| Android | 13.04% | |
| Desktop & Web | 85.28% | |
| Cayman Islands (the) | iOS | 49.86% |
| Android | 46.16% | |
| Desktop & Web | 3.98% | |
| Cyprus | iOS | 30.11% |
| Android | 47.02% | |
| Desktop & Web | 22.87% | |
| Czechia | iOS | 23.17% |
| Android | 59.61% | |
| Desktop & Web | 17.23% | |
| Germany | iOS | 27.12% |
| Android | 45.59% | |
| Desktop & Web | 27.29% | |
| Djibouti | iOS | 12.60% |
| Android | 66.72% | |
| Desktop & Web | 20.68% | |
| Dominica | iOS | 13.97% |
| Android | 84.24% | |
| Desktop & Web | 1.79% | |
| Denmark | iOS | 38.65% |
| Android | 22.65% | |
| Desktop & Web | 38.70% | |
| Dominican Republic (the) | iOS | 12.31% |
| Android | 84.99% | |
| Desktop & Web | 2.70% | |
| Algeria | iOS | 15.86% |
| Android | 75.56% | |
| Desktop & Web | 8.58% | |
| Ecuador | iOS | 24.20% |
| Android | 63.90% | |
| Desktop & Web | 11.90% | |
| Egypt | iOS | 20.32% |
| Android | 64.00% | |
| Desktop & Web | 15.69% | |
| Eritrea | iOS | 12.97% |
| Android | 51.50% | |
| Desktop & Web | 35.53% | |
| Western Sahara | iOS | 9.88% |
| Android | 50.63% | |
| Desktop & Web | 39.49% | |
| Spain | iOS | 20.66% |
| Android | 43.70% | |
| Desktop & Web | 35.64% | |
| Estonia | iOS | 29.29% |
| Android | 59.83% | |
| Desktop & Web | 10.89% | |
| Ethiopia | iOS | 5.86% |
| Android | 61.03% | |
| Desktop & Web | 33.11% | |
| Finland | iOS | 20.78% |
| Android | 39.05% | |
| Desktop & Web | 40.17% | |
| Fiji | iOS | 19.35% |
| Android | 63.33% | |
| Desktop & Web | 17.32% | |
| Falkland Islands (the) [Malvinas] | iOS | 43.66% |
| Android | 54.42% | |
| Desktop & Web | 1.92% | |
| France | iOS | 29.70% |
| Android | 36.66% | |
| Desktop & Web | 33.65% | |
| Faroe Islands (the) | iOS | 71.92% |
| Android | 24.23% | |
| Desktop & Web | 3.85% | |
| Micronesia (Federated States of) | iOS | 32.24% |
| Android | 66.61% | |
| Desktop & Web | 1.15% | |
| Gabon | iOS | 19.77% |
| Android | 69.73% | |
| Desktop & Web | 10.49% | |
| United Kingdom of Great Britain and Northern Ireland (the) | iOS | 35.13% |
| Android | 35.59% | |
| Desktop & Web | 29.28% | |
| Georgia | iOS | 32.57% |
| Android | 59.80% | |
| Desktop & Web | 7.63% | |
| Guernsey | iOS | 74.73% |
| Android | 22.62% | |
| Desktop & Web | 2.65% | |
| Ghana | iOS | 28.26% |
| Android | 30.03% | |
| Desktop & Web | 41.72% | |
| Gibraltar | iOS | 63.25% |
| Android | 30.00% | |
| Desktop & Web | 6.75% | |
| Guinea | iOS | 26.94% |
| Android | 60.79% | |
| Desktop & Web | 12.27% | |
| Guadeloupe | iOS | 26.03% |
| Android | 65.18% | |
| Desktop & Web | 8.79% | |
| Gambia (the) | iOS | 33.42% |
| Android | 53.56% | |
| Desktop & Web | 13.01% | |
| Guinea-Bissau | iOS | 13.72% |
| Android | 82.58% | |
| Desktop & Web | 3.70% | |
| Equatorial Guinea | iOS | 62.89% |
| Android | 34.69% | |
| Desktop & Web | 2.41% | |
| Greece | iOS | 19.12% |
| Android | 42.45% | |
| Desktop & Web | 38.43% | |
| Grenada | iOS | 12.41% |
| Android | 82.14% | |
| Desktop & Web | 5.45% | |
| Greenland | iOS | 57.93% |
| Android | 39.46% | |
| Desktop & Web | 2.61% | |
| Guatemala | iOS | 5.22% |
| Android | 90.84% | |
| Desktop & Web | 3.94% | |
| French Guiana | iOS | 39.26% |
| Android | 48.16% | |
| Desktop & Web | 12.58% | |
| Guam | iOS | 60.78% |
| Android | 38.18% | |
| Desktop & Web | 1.04% | |
| Guyana | iOS | 31.21% |
| Android | 62.76% | |
| Desktop & Web | 6.02% | |
| Hong Kong | iOS | 54.45% |
| Android | 27.75% | |
| Desktop & Web | 17.81% | |
| Heard Island and McDonald Islands | iOS | |
| Android | ||
| Honduras | iOS | 8.17% |
| Android | 90.83% | |
| Desktop & Web | 1.00% | |
| Croatia | iOS | 19.93% |
| Android | 72.48% | |
| Desktop & Web | 7.59% | |
| Haiti | iOS | 1.24% |
| Android | 98.12% | |
| Desktop & Web | 0.64% | |
| Hungary | iOS | 18.93% |
| Android | 56.09% | |
| Desktop & Web | 24.98% | |
| Indonesia | iOS | 18.39% |
| Android | 79.21% | |
| Desktop & Web | 2.40% | |
| Isle of Man | iOS | 68.99% |
| Android | 27.15% | |
| Desktop & Web | 3.87% | |
| India | iOS | 9.84% |
| Android | 70.44% | |
| Desktop & Web | 19.72% | |
| British Indian Ocean Territory (the) | iOS | 25.92% |
| Android | 70.11% | |
| Desktop & Web | 3.97% | |
| Ireland | iOS | 17.23% |
| Android | 31.27% | |
| Desktop & Web | 51.50% | |
| Iran (Islamic Republic of) | iOS | 14.94% |
| Android | 85.03% | |
| Desktop & Web | 0.03% | |
| Iraq | iOS | 49.93% |
| Android | 44.83% | |
| Desktop & Web | 5.24% | |
| Iceland | iOS | 46.90% |
| Android | 45.64% | |
| Desktop & Web | 7.47% | |
| Israel | iOS | 41.00% |
| Android | 37.12% | |
| Desktop & Web | 21.87% | |
| Italy | iOS | 25.93% |
| Android | 43.52% | |
| Desktop & Web | 30.55% | |
| Jamaica | iOS | 10.67% |
| Android | 84.88% | |
| Desktop & Web | 4.45% | |
| Jersey | iOS | 51.08% |
| Android | 15.19% | |
| Desktop & Web | 33.73% | |
| Jordan | iOS | 45.79% |
| Android | 49.90% | |
| Desktop & Web | 4.31% | |
| Japan | iOS | 45.65% |
| Android | 39.47% | |
| Desktop & Web | 14.88% | |
| Kazakhstan | iOS | 29.46% |
| Android | 68.90% | |
| Desktop & Web | 1.64% | |
| Kenya | iOS | 9.21% |
| Android | 75.68% | |
| Desktop & Web | 15.11% | |
| Kyrgyzstan | iOS | 20.97% |
| Android | 77.89% | |
| Desktop & Web | 1.14% | |
| Cambodia | iOS | 47.79% |
| Android | 46.25% | |
| Desktop & Web | 5.97% | |
| Kiribati | iOS | 10.25% |
| Android | 74.61% | |
| Desktop & Web | 15.15% | |
| Saint Kitts and Nevis | iOS | 21.13% |
| Android | 77.00% | |
| Desktop & Web | 1.88% | |
| Korea (the Republic of) | iOS | 21.62% |
| Android | 70.44% | |
| Desktop & Web | 7.94% | |
| Kuwait | iOS | 53.08% |
| Android | 29.49% | |
| Desktop & Web | 17.44% | |
| Lao People’s Democratic Republic (the) | iOS | 47.38% |
| Android | 48.22% | |
| Desktop & Web | 4.40% | |
| Lebanon | iOS | 35.63% |
| Android | 55.08% | |
| Desktop & Web | 9.28% | |
| Liberia | iOS | 31.82% |
| Android | 55.31% | |
| Desktop & Web | 12.88% | |
| Libya | iOS | 30.10% |
| Android | 65.37% | |
| Desktop & Web | 4.53% | |
| Saint Lucia | iOS | 12.36% |
| Android | 85.94% | |
| Desktop & Web | 1.71% | |
| Liechtenstein | iOS | 58.06% |
| Android | 27.79% | |
| Desktop & Web | 14.15% | |
| Sri Lanka | iOS | 22.35% |
| Android | 64.77% | |
| Desktop & Web | 12.88% | |
| Lesotho | iOS | 13.14% |
| Android | 56.70% | |
| Desktop & Web | 30.15% | |
| Lithuania | iOS | 25.93% |
| Android | 66.84% | |
| Desktop & Web | 7.23% | |
| Luxembourg | iOS | 37.53% |
| Android | 43.84% | |
| Desktop & Web | 18.63% | |
| Latvia | iOS | 26.66% |
| Android | 64.26% | |
| Desktop & Web | 9.08% | |
| Macao | iOS | 78.29% |
| Android | 20.45% | |
| Desktop & Web | 1.26% | |
| Saint Martin (French part) | iOS | 42.65% |
| Android | 56.29% | |
| Desktop & Web | 1.06% | |
| Morocco | iOS | 14.88% |
| Android | 48.45% | |
| Desktop & Web | 36.67% | |
| Monaco | iOS | 69.91% |
| Android | 18.64% | |
| Desktop & Web | 11.44% | |
| Moldova (the Republic of) | iOS | 26.79% |
| Android | 68.44% | |
| Desktop & Web | 4.77% | |
| Madagascar | iOS | 17.26% |
| Android | 56.89% | |
| Desktop & Web | 25.85% | |
| Maldives | iOS | 31.30% |
| Android | 58.37% | |
| Desktop & Web | 10.33% | |
| Mexico | iOS | 15.57% |
| Android | 63.25% | |
| Desktop & Web | 21.18% | |
| Marshall Islands (the) | iOS | 40.48% |
| Android | 57.39% | |
| Desktop & Web | 2.13% | |
| Republic of North Macedonia | iOS | 37.50% |
| Android | 52.47% | |
| Desktop & Web | 10.03% | |
| Mali | iOS | 18.11% |
| Android | 61.38% | |
| Desktop & Web | 20.52% | |
| Malta | iOS | 39.04% |
| Android | 53.45% | |
| Desktop & Web | 7.51% | |
| Myanmar | iOS | 14.57% |
| Android | 73.68% | |
| Desktop & Web | 11.75% | |
| Montenegro | iOS | 52.37% |
| Android | 41.90% | |
| Desktop & Web | 5.73% | |
| Mongolia | iOS | 58.05% |
| Android | 33.56% | |
| Desktop & Web | 8.38% | |
| Northern Mariana Islands (the) | iOS | 61.86% |
| Android | 36.43% | |
| Desktop & Web | 1.71% | |
| Mozambique | iOS | 13.89% |
| Android | 72.64% | |
| Desktop & Web | 13.47% | |
| Mauritania | iOS | 36.38% |
| Android | 53.73% | |
| Desktop & Web | 9.89% | |
| Montserrat | iOS | 24.71% |
| Android | 72.65% | |
| Desktop & Web | 2.65% | |
| Martinique | iOS | 26.83% |
| Android | 68.09% | |
| Desktop & Web | 5.08% | |
| Mauritius | iOS | 23.84% |
| Android | 67.98% | |
| Desktop & Web | 8.19% | |
| Malawi | iOS | 10.39% |
| Android | 81.34% | |
| Desktop & Web | 8.27% | |
| Malaysia | iOS | 31.27% |
| Android | 64.82% | |
| Desktop & Web | 3.92% | |
| Mayotte | iOS | 29.20% |
| Android | 49.44% | |
| Desktop & Web | 21.36% | |
| Namibia | iOS | 27.29% |
| Android | 63.39% | |
| Desktop & Web | 9.32% | |
| New Caledonia | iOS | 46.65% |
| Android | 44.21% | |
| Desktop & Web | 9.14% | |
| Niger (the) | iOS | 14.76% |
| Android | 72.33% | |
| Desktop & Web | 12.91% | |
| Norfolk Island | iOS | 33.64% |
| Android | 49.14% | |
| Desktop & Web | 17.22% | |
| Nigeria | iOS | 13.05% |
| Android | 80.77% | |
| Desktop & Web | 6.18% | |
| Nicaragua | iOS | 2.47% |
| Android | 96.85% | |
| Desktop & Web | 0.68% | |
| Niue | iOS | 16.41% |
| Android | 77.72% | |
| Desktop & Web | 5.88% | |
| Netherlands (the) | iOS | 20.74% |
| Android | 36.00% | |
| Desktop & Web | 43.26% | |
| Norway | iOS | 37.91% |
| Android | 32.96% | |
| Desktop & Web | 29.13% | |
| Nepal | iOS | 39.39% |
| Android | 47.07% | |
| Desktop & Web | 13.53% | |
| Nauru | iOS | 15.42% |
| Android | 73.20% | |
| Desktop & Web | 11.39% | |
| New Zealand | iOS | 27.73% |
| Android | 39.71% | |
| Desktop & Web | 32.56% | |
| Oman | iOS | 32.26% |
| Android | 60.19% | |
| Desktop & Web | 7.55% | |
| Pakistan | iOS | 17.24% |
| Android | 63.90% | |
| Desktop & Web | 18.86% | |
| Panama | iOS | 12.27% |
| Android | 85.05% | |
| Desktop & Web | 2.68% | |
| Pitcairn | iOS | 67.30% |
| Android | 19.46% | |
| Desktop & Web | 13.24% | |
| Peru | iOS | 19.80% |
| Android | 64.60% | |
| Desktop & Web | 15.61% | |
| Philippines (the) | iOS | 21.56% |
| Android | 70.42% | |
| Desktop & Web | 8.03% | |
| Palau | iOS | 38.42% |
| Android | 60.21% | |
| Desktop & Web | 1.37% | |
| Papua New Guinea | iOS | 5.70% |
| Android | 63.78% | |
| Desktop & Web | 30.52% | |
| Poland | iOS | 16.28% |
| Android | 43.10% | |
| Desktop & Web | 40.62% | |
| Puerto Rico | iOS | 49.42% |
| Android | 44.13% | |
| Desktop & Web | 6.44% | |
| Korea (the Democratic People’s Republic of) | iOS | 34.39% |
| Android | 65.61% | |
| Desktop & Web | ||
| Portugal | iOS | 28.14% |
| Android | 43.77% | |
| Desktop & Web | 28.09% | |
| Paraguay | iOS | 20.34% |
| Android | 73.12% | |
| Desktop & Web | 6.54% | |
| Palestine, State of | iOS | 40.07% |
| Android | 46.05% | |
| Desktop & Web | 13.88% | |
| French Polynesia | iOS | 39.47% |
| Android | 37.58% | |
| Desktop & Web | 22.95% | |
| Qatar | iOS | 49.18% |
| Android | 31.55% | |
| Desktop & Web | 19.27% | |
| Réunion | iOS | 38.07% |
| Android | 48.08% | |
| Desktop & Web | 13.84% | |
| Romania | iOS | 24.59% |
| Android | 62.97% | |
| Desktop & Web | 12.44% | |
| Russian Federation (the) | iOS | 32.93% |
| Android | 65.26% | |
| Desktop & Web | 1.81% | |
| Rwanda | iOS | 12.33% |
| Android | 70.72% | |
| Desktop & Web | 16.96% | |
| Saudi Arabia | iOS | 46.46% |
| Android | 36.74% | |
| Desktop & Web | 16.80% | |
| Sudan (the) | iOS | 1.14% |
| Android | 87.99% | |
| Desktop & Web | 10.86% | |
| Senegal | iOS | 40.93% |
| Android | 43.61% | |
| Desktop & Web | 15.46% | |
| Singapore | iOS | 36.78% |
| Android | 48.73% | |
| Desktop & Web | 14.49% | |
| South Georgia and the South Sandwich Islands | iOS | 11.42% |
| Android | 88.58% | |
| Desktop & Web | ||
| Saint Helena, Ascension and Tristan da Cunha | iOS | 18.13% |
| Android | 79.82% | |
| Desktop & Web | 2.04% | |
| Svalbard and Jan Mayen | iOS | 59.43% |
| Android | 37.91% | |
| Desktop & Web | 2.66% | |
| Solomon Islands | iOS | 12.07% |
| Android | 68.66% | |
| Desktop & Web | 19.27% | |
| Sierra Leone | iOS | 33.02% |
| Android | 54.78% | |
| Desktop & Web | 12.20% | |
| El Salvador | iOS | 5.95% |
| Android | 88.95% | |
| Desktop & Web | 5.10% | |
| San Marino | iOS | 48.53% |
| Android | 41.07% | |
| Desktop & Web | 10.40% | |
| Somalia | iOS | 13.54% |
| Android | 65.17% | |
| Desktop & Web | 21.29% | |
| Saint Pierre and Miquelon | iOS | 52.86% |
| Android | 43.26% | |
| Desktop & Web | 3.89% | |
| Serbia | iOS | 24.94% |
| Android | 70.90% | |
| Desktop & Web | 4.16% | |
| South Sudan | iOS | 22.13% |
| Android | 68.16% | |
| Desktop & Web | 9.71% | |
| Sao Tome and Principe | iOS | 20.25% |
| Android | 74.80% | |
| Desktop & Web | 4.95% | |
| Suriname | iOS | 37.74% |
| Android | 56.32% | |
| Desktop & Web | 5.95% | |
| Slovakia | iOS | 18.14% |
| Android | 62.07% | |
| Desktop & Web | 19.79% | |
| Slovenia | iOS | 21.53% |
| Android | 41.11% | |
| Desktop & Web | 37.36% | |
| Sweden | iOS | 37.49% |
| Android | 37.92% | |
| Desktop & Web | 24.59% | |
| Eswatini | iOS | 15.54% |
| Android | 59.14% | |
| Desktop & Web | 25.32% | |
| Sint Maarten (Dutch part) | iOS | 34.71% |
| Android | 62.94% | |
| Desktop & Web | 2.34% | |
| Seychelles | iOS | 32.52% |
| Android | 58.89% | |
| Desktop & Web | 8.59% | |
| Syrian Arab Republic | iOS | 4.98% |
| Android | 95.01% | |
| Desktop & Web | 0.00% | |
| Turks and Caicos Islands (the) | iOS | 40.69% |
| Android | 56.14% | |
| Desktop & Web | 3.17% | |
| Chad | iOS | 16.35% |
| Android | 74.78% | |
| Desktop & Web | 8.87% | |
| Togo | iOS | 12.45% |
| Android | 65.91% | |
| Desktop & Web | 21.64% | |
| Thailand | iOS | 38.70% |
| Android | 54.53% | |
| Desktop & Web | 6.77% | |
| Tajikistan | iOS | 10.17% |
| Android | 88.78% | |
| Desktop & Web | 1.05% | |
| Tokelau | iOS | 16.54% |
| Android | 81.18% | |
| Desktop & Web | 2.28% | |
| Turkmenistan | iOS | 9.47% |
| Android | 88.48% | |
| Desktop & Web | 2.04% | |
| Timor-Leste | iOS | 20.13% |
| Android | 69.38% | |
| Desktop & Web | 10.49% | |
| Tonga | iOS | 41.95% |
| Android | 48.80% | |
| Desktop & Web | 9.25% | |
| Trinidad and Tobago | iOS | 13.05% |
| Android | 85.31% | |
| Desktop & Web | 1.64% | |
| Tunisia | iOS | 22.45% |
| Android | 67.81% | |
| Desktop & Web | 9.73% | |
| Turkey | iOS | 30.19% |
| Android | 64.20% | |
| Desktop & Web | 5.61% | |
| Tuvalu | iOS | 28.62% |
| Android | 54.14% | |
| Desktop & Web | 17.24% | |
| Taiwan (Province of China) | iOS | 48.07% |
| Android | 27.60% | |
| Desktop & Web | 24.33% | |
| Tanzania, United Republic of | iOS | 22.55% |
| Android | 63.26% | |
| Desktop & Web | 14.19% | |
| Uganda | iOS | 11.44% |
| Android | 74.13% | |
| Desktop & Web | 14.42% | |
| Ukraine | iOS | 19.34% |
| Android | 78.61% | |
| Desktop & Web | 2.06% | |
| United States Minor Outlying Islands (the) | iOS | 0.02% |
| Android | 99.98% | |
| Desktop & Web | ||
| Uruguay | iOS | 20.31% |
| Android | 66.72% | |
| Desktop & Web | 12.97% | |
| United States of America (the) | iOS | 39.15% |
| Android | 28.16% | |
| Desktop & Web | 32.69% | |
| Uzbekistan | iOS | 20.41% |
| Android | 77.69% | |
| Desktop & Web | 1.90% | |
| Holy See (the) | iOS | 16.62% |
| Android | 44.12% | |
| Desktop & Web | 39.25% | |
| Saint Vincent and the Grenadines | iOS | 10.33% |
| Android | 88.12% | |
| Desktop & Web | 1.55% | |
| Venezuela (Bolivarian Republic of) | iOS | 8.41% |
| Android | 88.13% | |
| Desktop & Web | 3.47% | |
| Virgin Islands (British) | iOS | 37.77% |
| Android | 58.06% | |
| Desktop & Web | 4.18% | |
| Virgin Islands (U.S.) | iOS | 56.75% |
| Android | 41.59% | |
| Desktop & Web | 1.65% | |
| Viet Nam | iOS | 36.33% |
| Android | 53.12% | |
| Desktop & Web | 10.54% | |
| Vanuatu | iOS | 16.01% |
| Android | 57.16% | |
| Desktop & Web | 26.83% | |
| Wallis and Futuna | iOS | 40.66% |
| Android | 54.76% | |
| Desktop & Web | 4.58% | |
| Samoa | iOS | 35.28% |
| Android | 62.24% | |
| Desktop & Web | 2.47% | |
| Yemen | iOS | 8.49% |
| Android | 90.00% | |
| Desktop & Web | 1.51% | |
| South Africa | iOS | 19.22% |
| Android | 52.26% | |
| Desktop & Web | 28.52% | |
| Zambia | iOS | 21.50% |
| Android | 67.34% | |
| Desktop & Web | 11.16% | |
| Zimbabwe | iOS | 22.47% |
| Android | 61.43% | |
| Desktop & Web | 16.11% |
Paid vs organic installs
All platforms global
Organic dipped in Q4 to 51.5% of all installs Singular measured, with Paid taking 48.5%.
Organic was 53.42% and paid installs were at 46.6% in Q3.
Android global
Organic is still much higher on Android at almost 57% of all installs, down slightly from last quarter.
iOS global
As usual, iOS is more heavily oriented to paid marketing thanks to the significantly higher revenue app publishers can generate on the platform.
Still, that dipped in Q4, hitting 57% paid from 60% in Q3.
Partner contributions
Apple Search Ads
In 2024, SplitMetrics Acquire, a leading Apple Search Ads management solution powered by Samba AI, helped advertisers optimize over 1.5 million campaigns with $600 million in annual ad spend combined. Leveraging AI-powered automation, advertisers efficiently managed 22 million keywords, made over 70,000 daily bid adjustments, and actively tracked 71,000 competitors to stay ahead in an increasingly competitive landscape.
Search results ad placement remains the most popular choice among SplitMetrics Acquire clients, delivering top performance, strong engagement, and exceptional revenue outcomes. In this section, we share insights into the performance metrics achieved by SplitMetrics Acquire clients specifically within this ad placement.
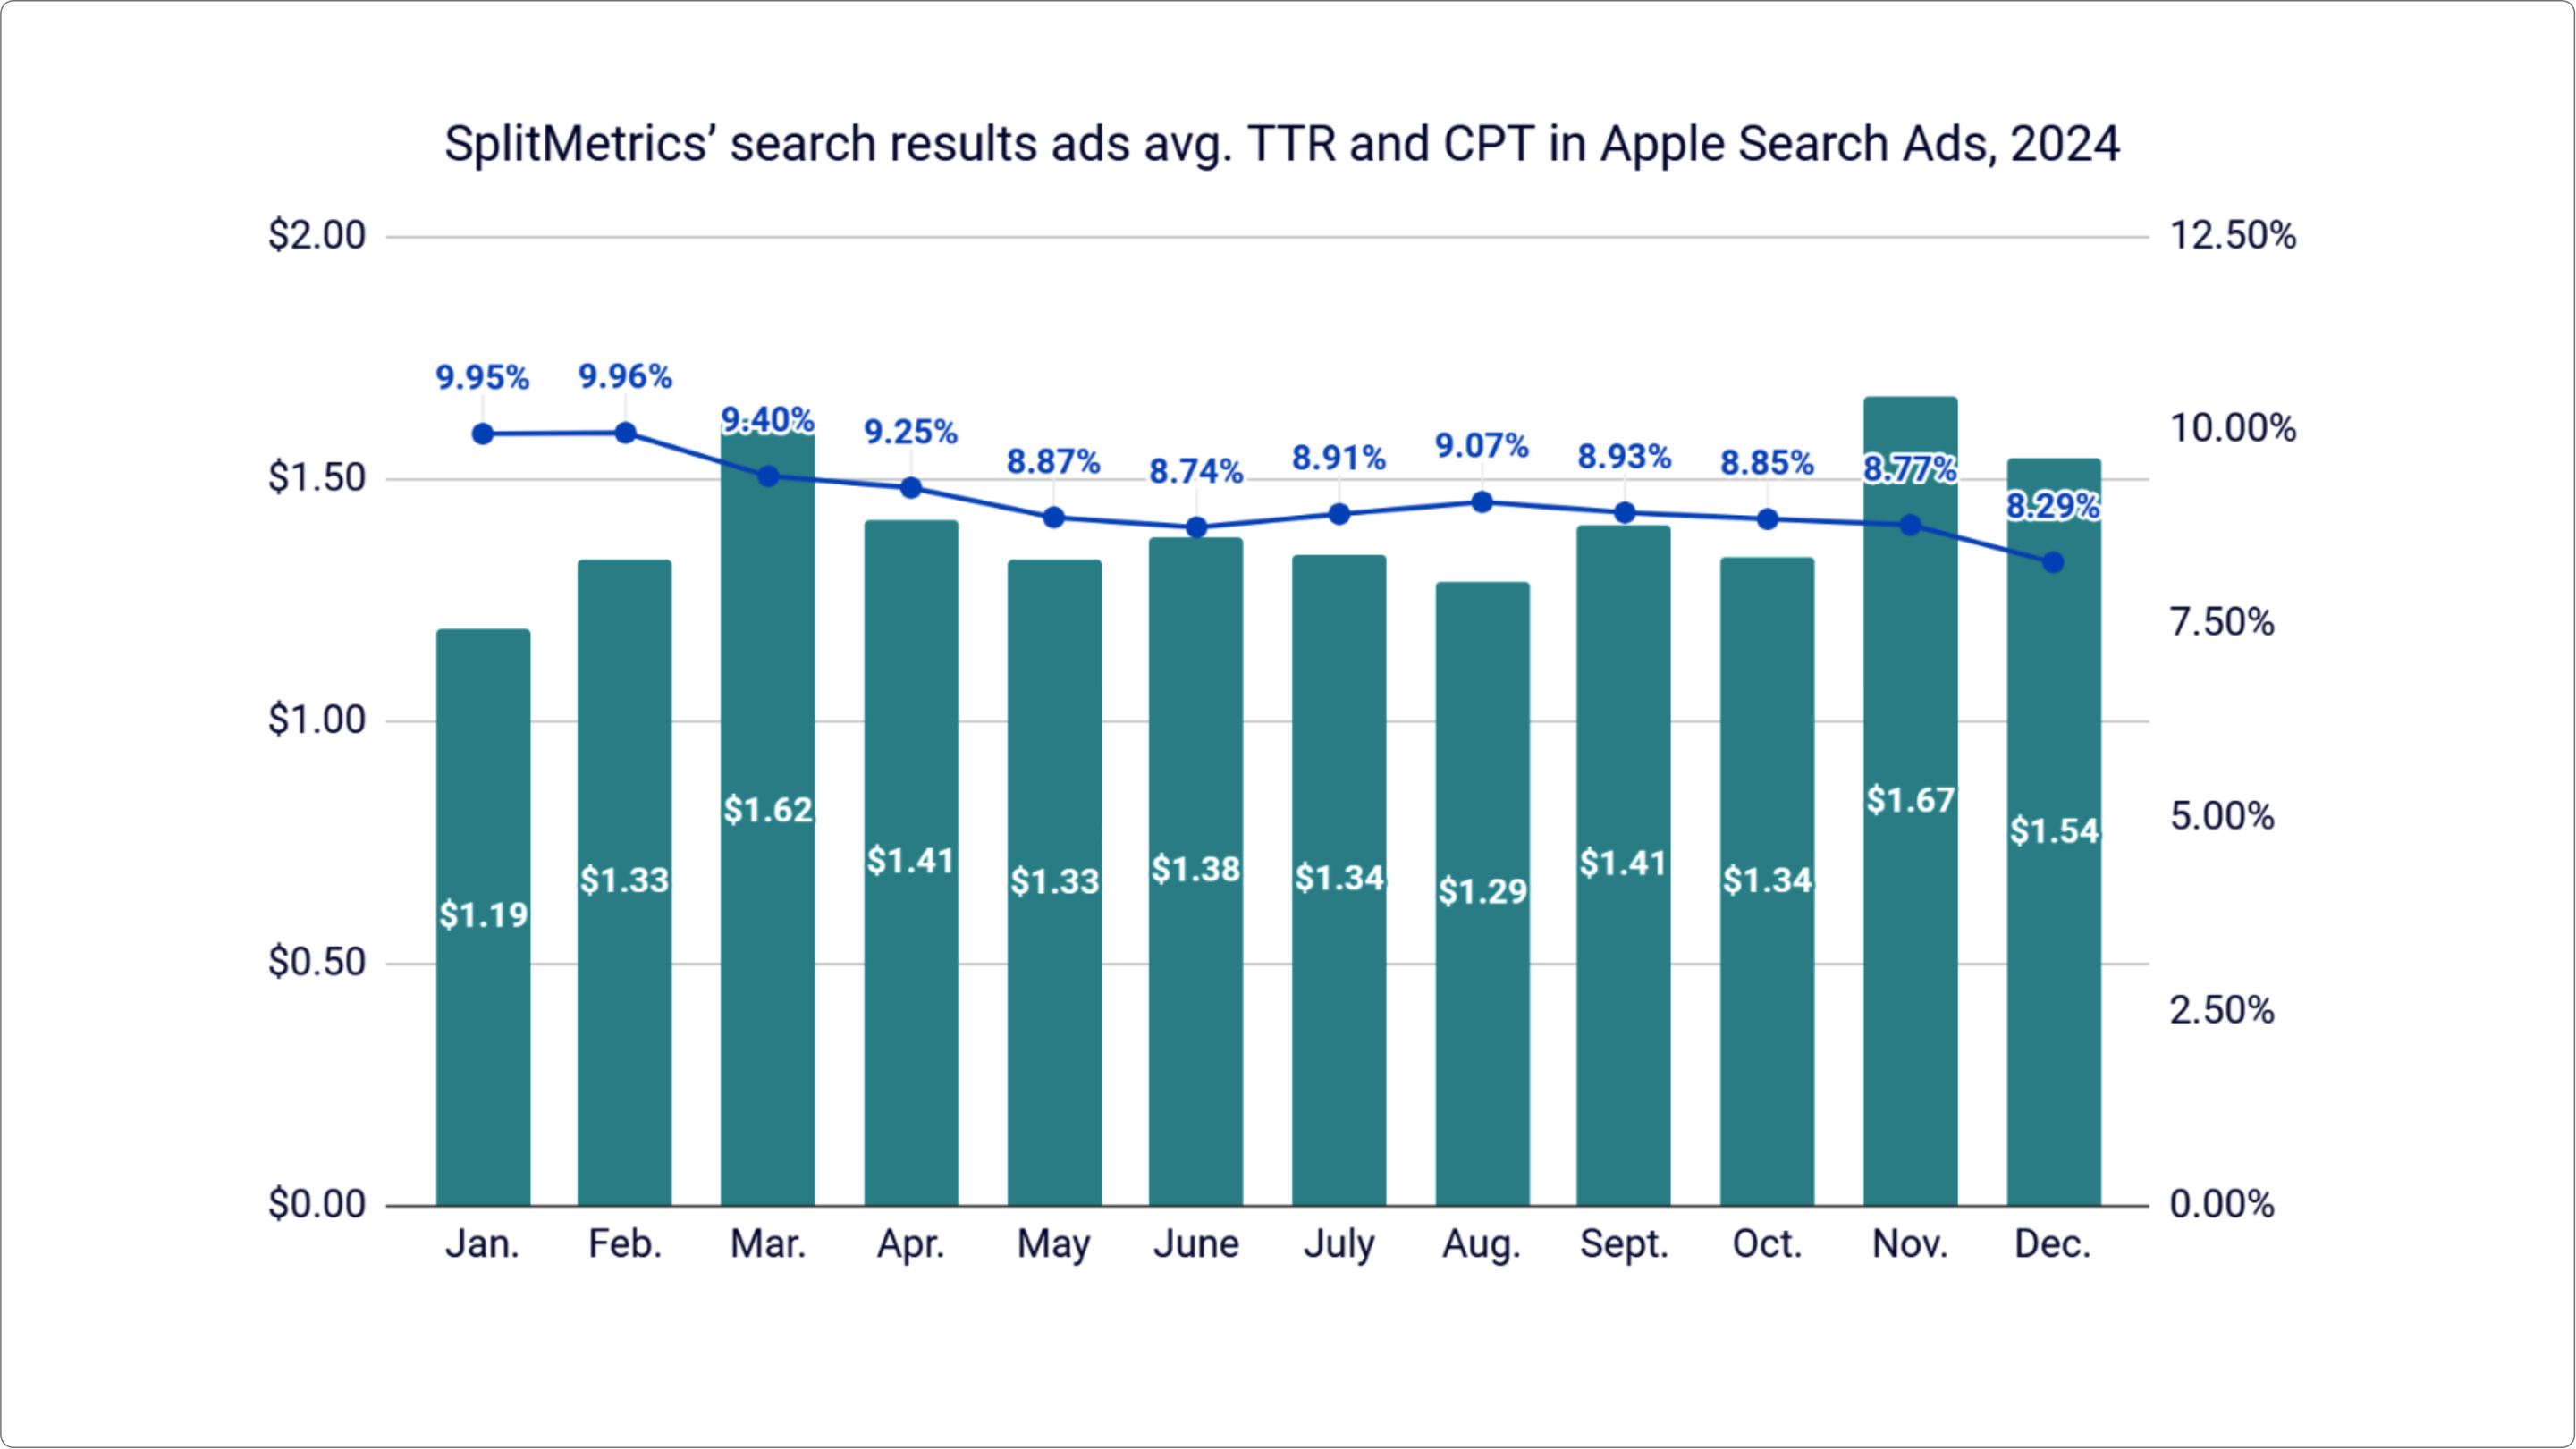
The average tap-through rate (TTR) for Apple Search Ads search results campaigns managed through SplitMetrics Acquire in 2024 was 9.01%, reflecting a slight decline from 10.22% in 2023. However, despite the decrease in TTR, advertisers maintained strong conversion rates (CR), averaging 64.01% for the year.
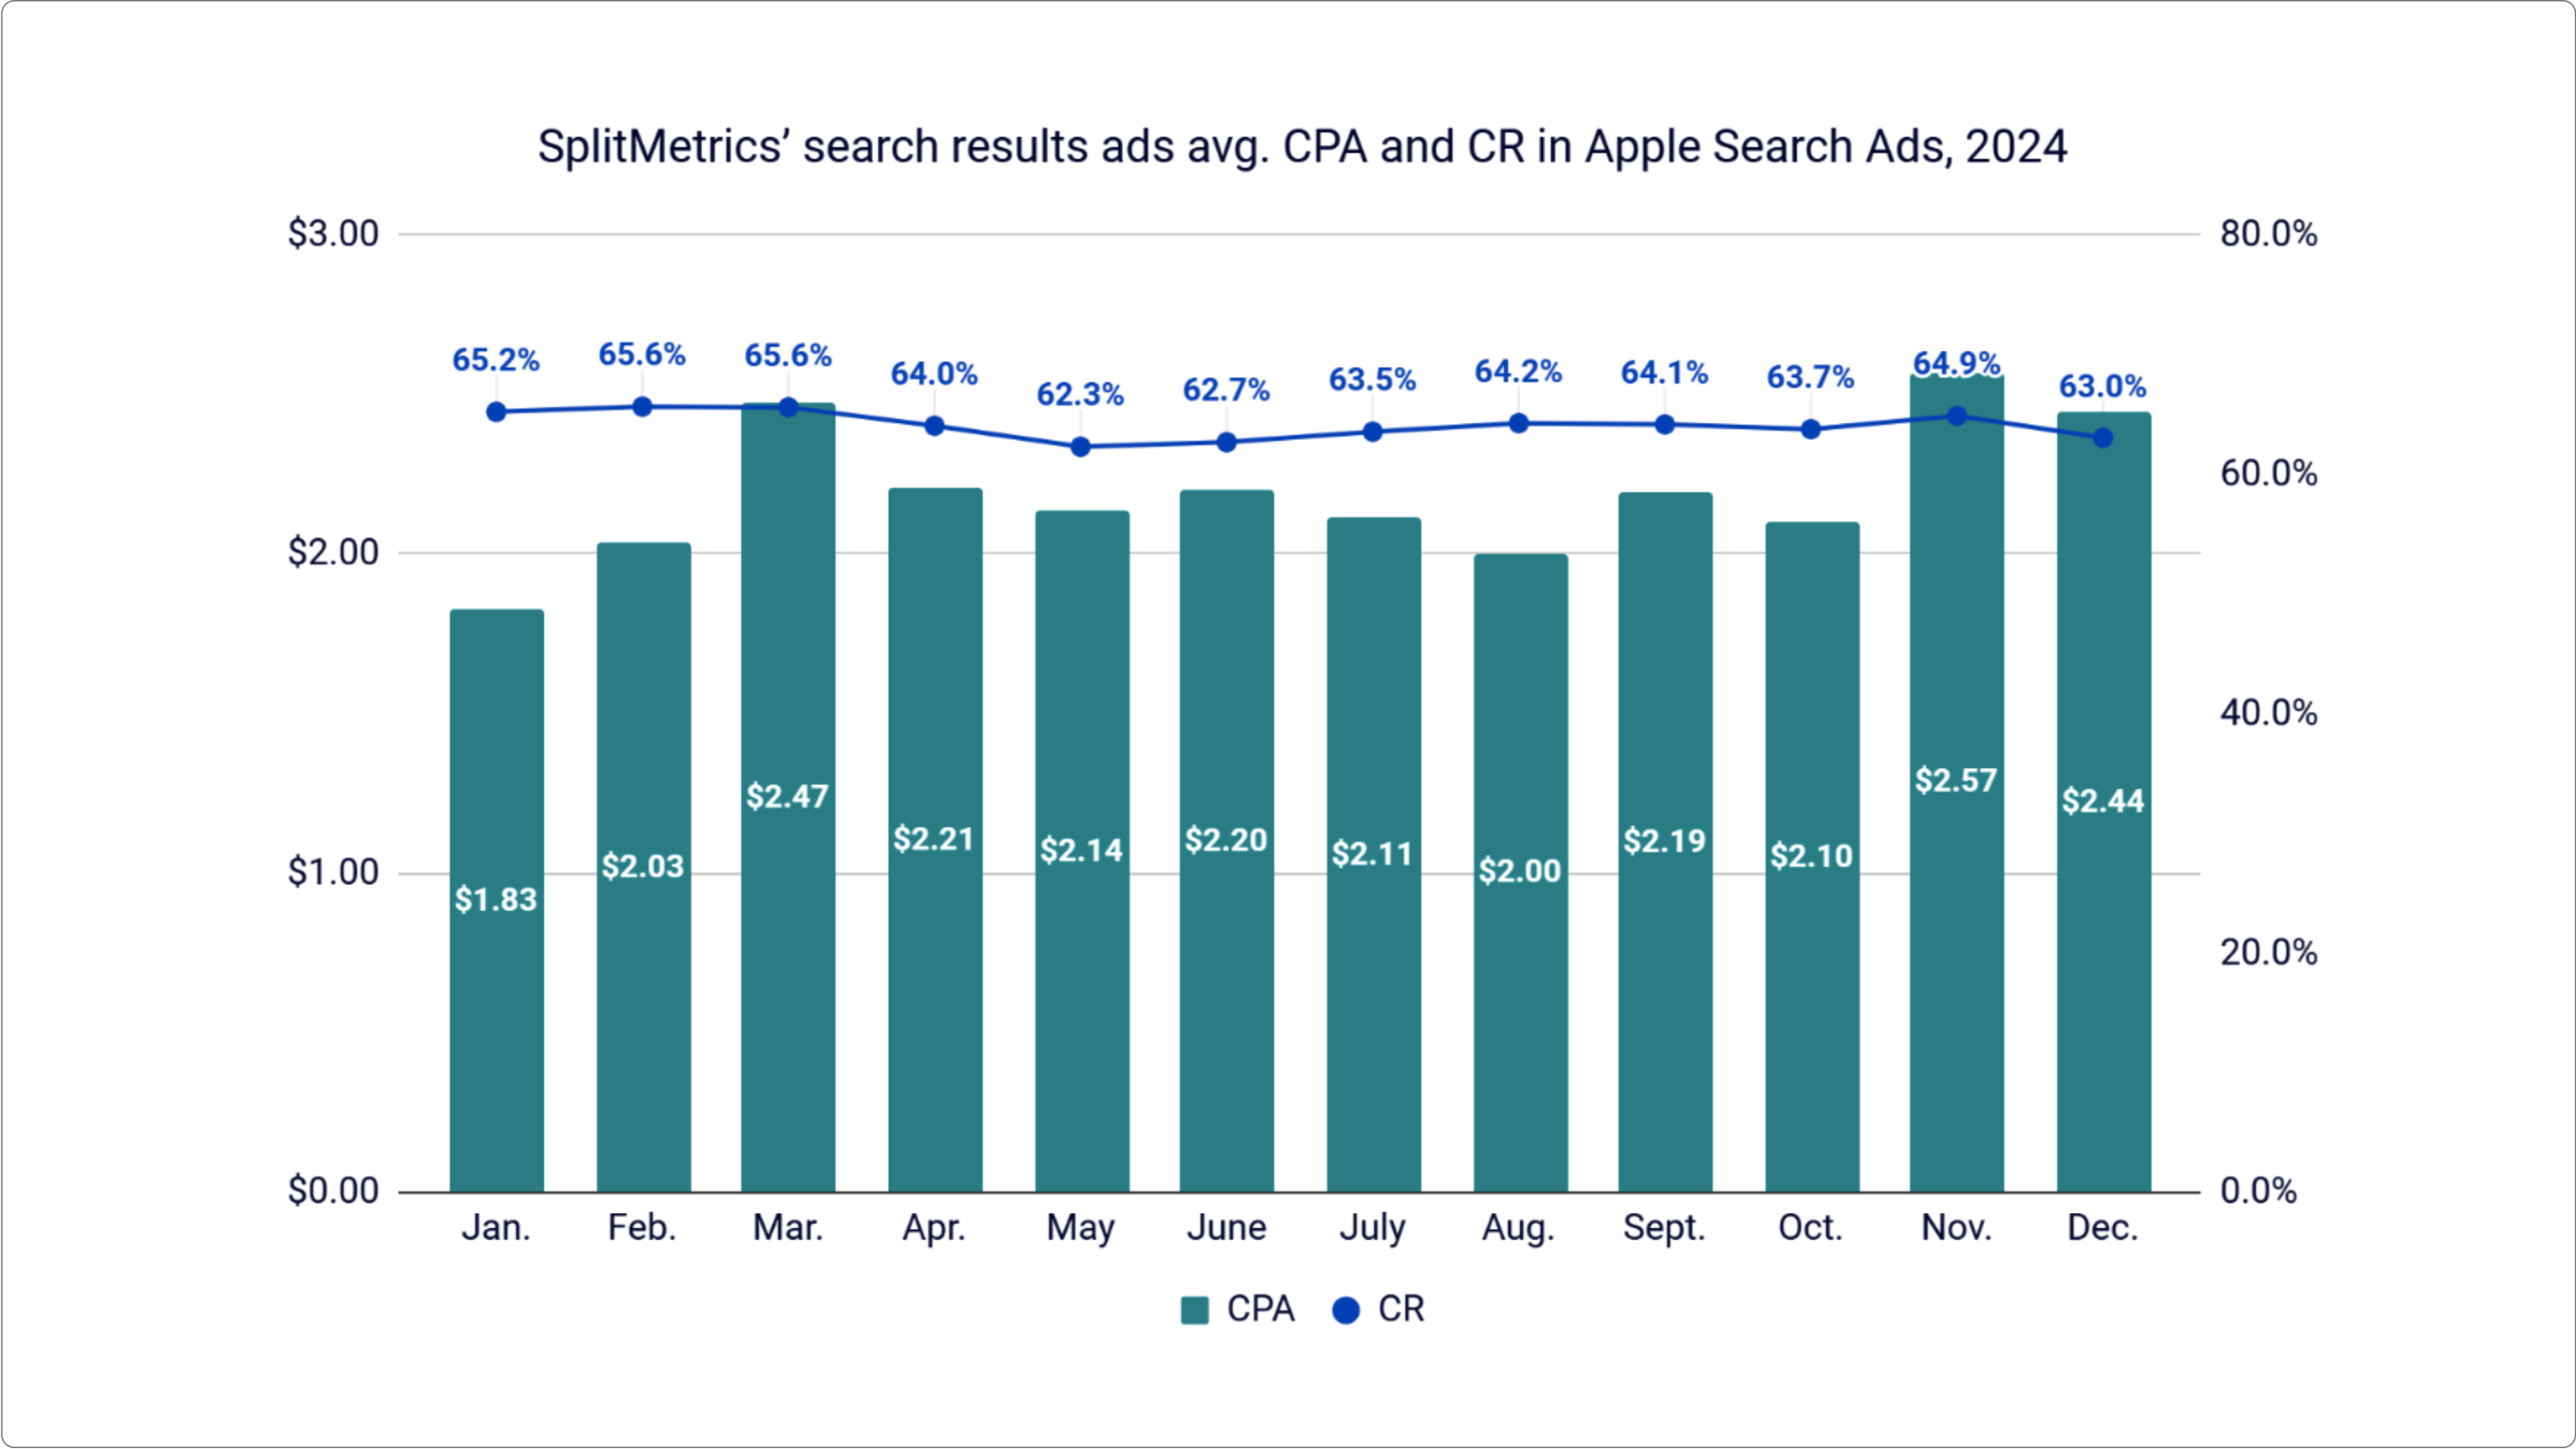
Advertising costs for Apple Search Ads search results campaigns managed through SplitMetrics Acquire saw an upward trend in 2024, driven by increased competition for premium keywords. The average cost-per-tap (CPT) grew from $1.19 in 2023 to $1.41, while the cost-per-acquisition (CPA) climbed from $1.81 to $2.20, highlighting the pressing need for smarter bidding strategies and automation to maintain cost efficiency.
These trends can largely be attributed to increased ad investments from sports, entertainment, and gaming advertisers during the Paris 2024 Olympic Games and EURO 2024, as well as a surge in finance app spending in November and December, fueled by Bitcoin’s growth.
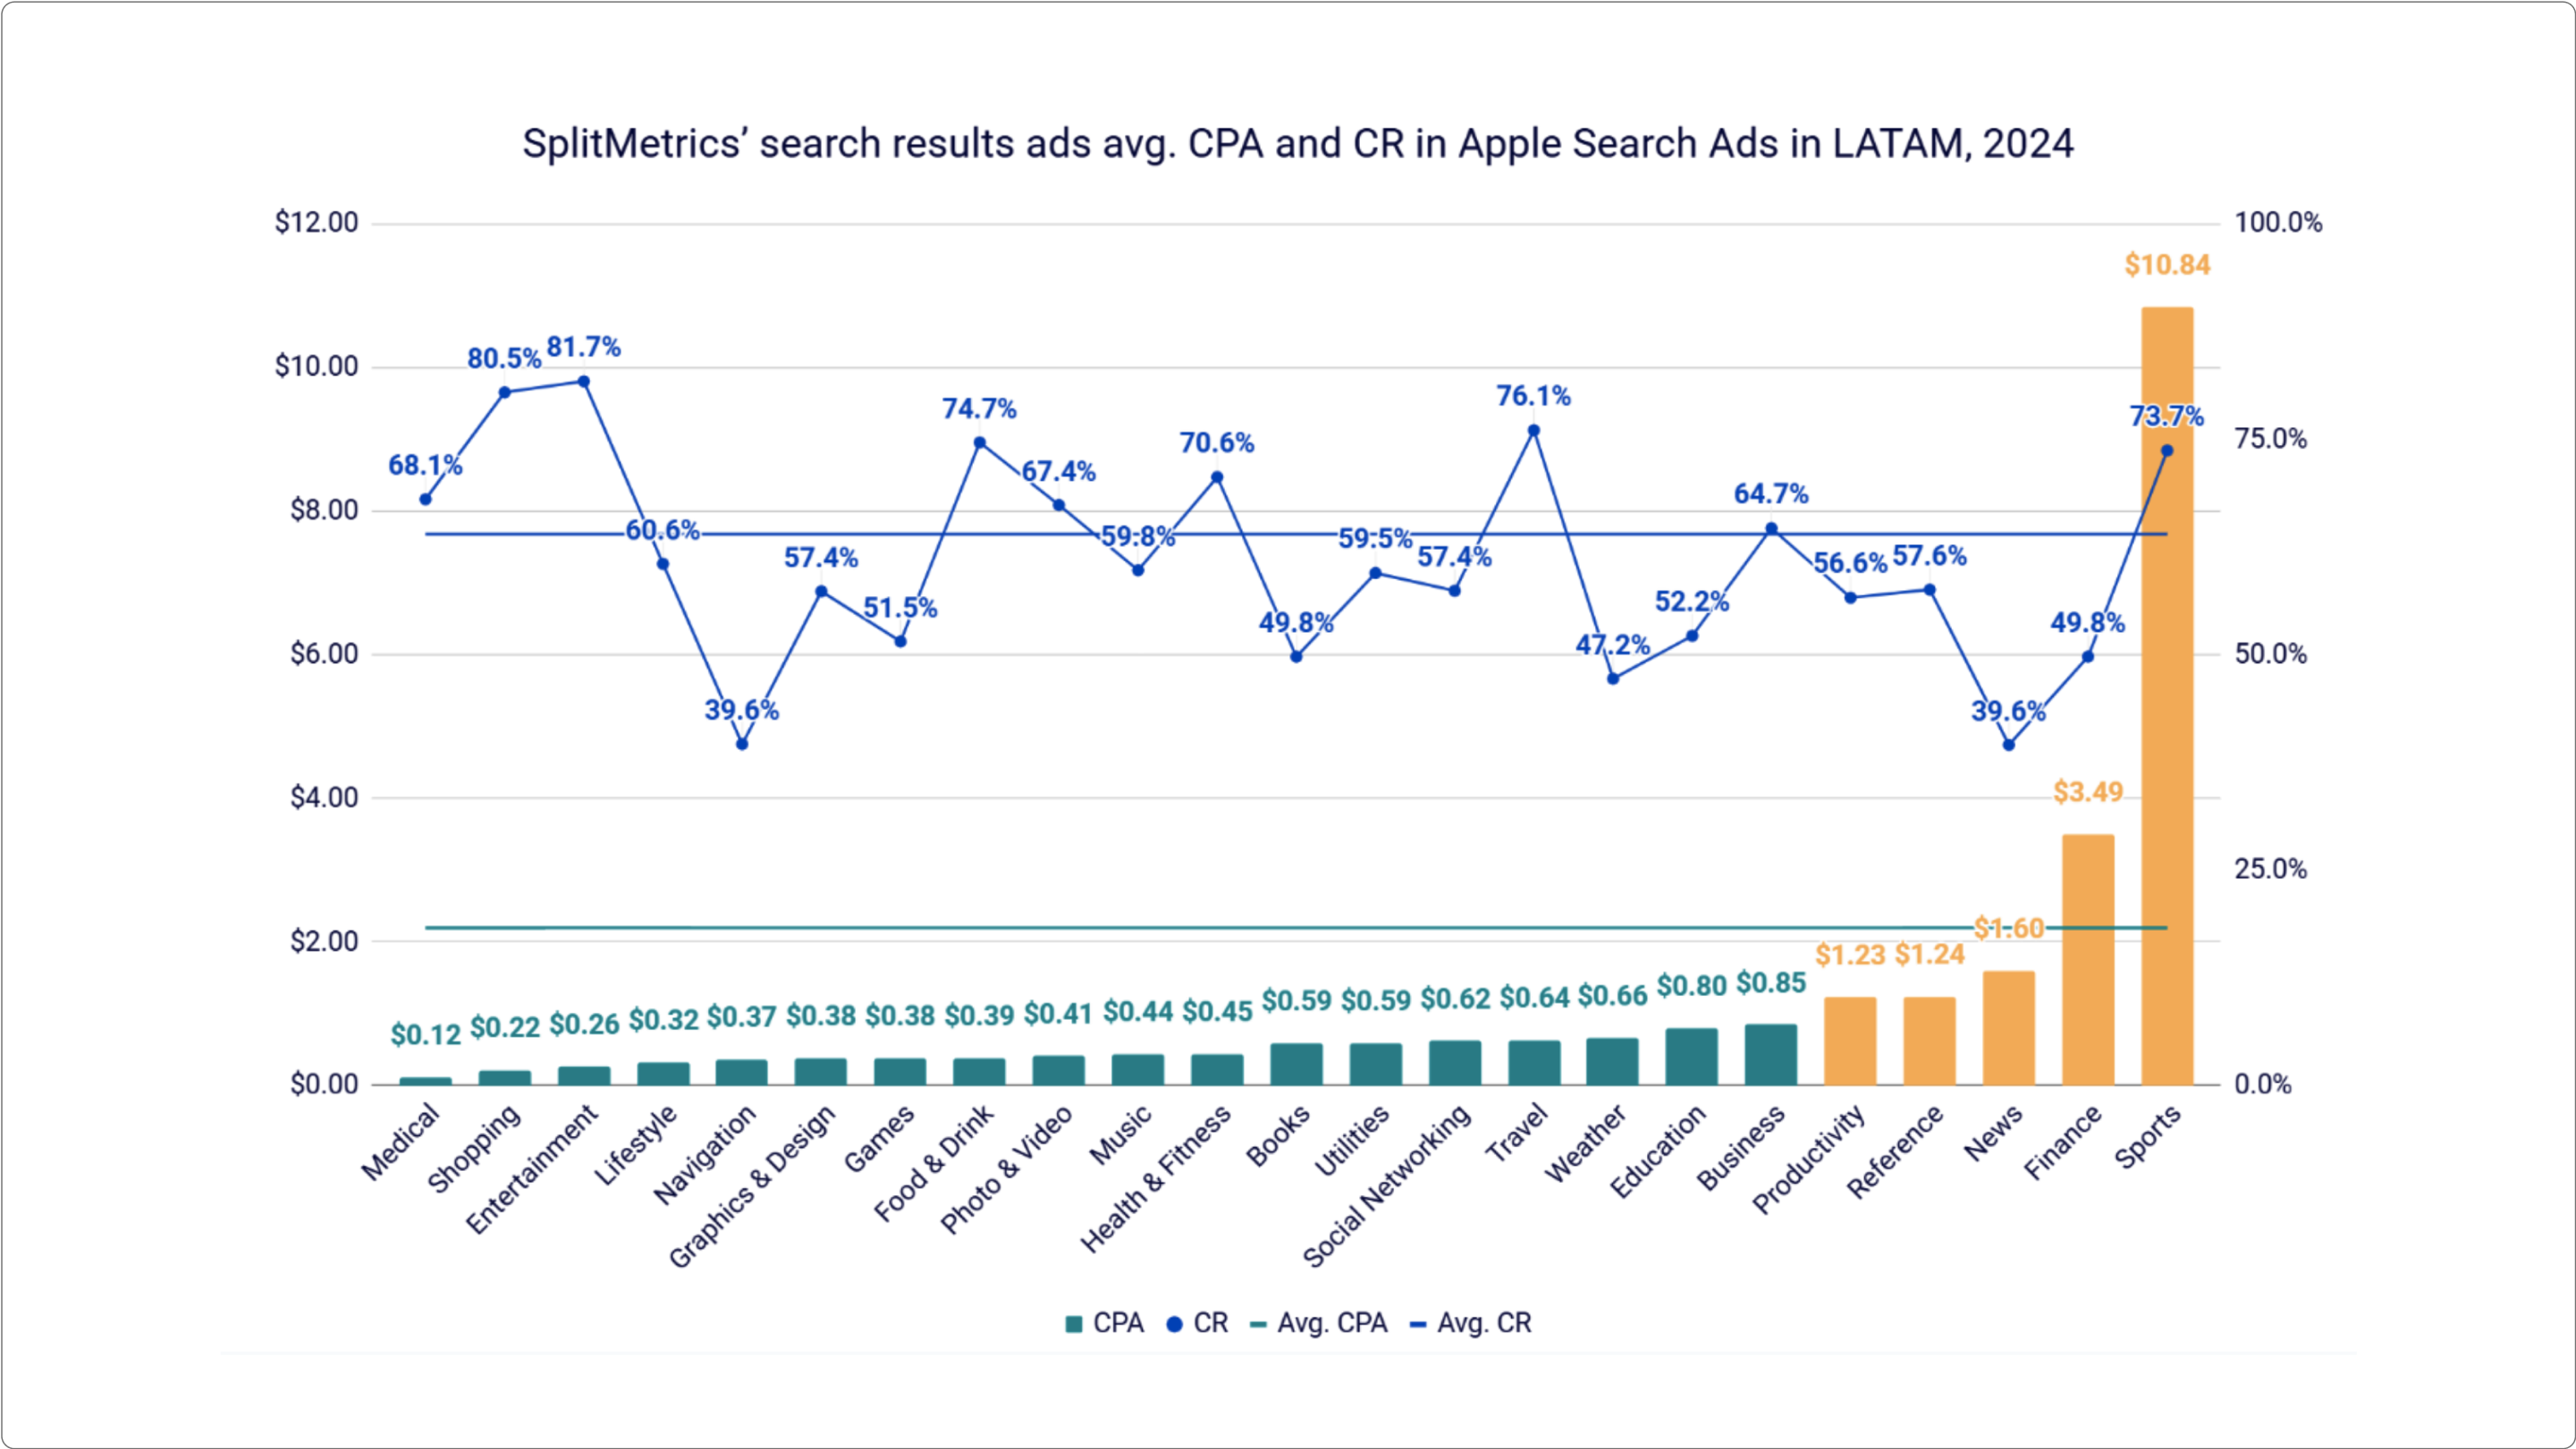
At the beginning of 2024, Apple Search Ads expanded into Brazil and other Latin American markets, presenting new scaling opportunities for advertisers. According to aggregated data from Apple Search Ads search results campaigns managed through SplitMetrics Acquire, the top five categories by CPA in these regions were Sports ($10.84), Finance ($3.49), News ($1.60), Reference ($1.24), and Productivity ($1.23). Apart from Sports and Finance, most app categories in LATAM had a lower CPA than the overall channel averages in 2024 and a relatively high CR. This suggests strong user engagement and cost-efficient acquisition opportunities in these emerging markets.
The CPA for the Sports category in LATAM started increasing in March 2024 and stayed above $10.00 through December. This increase aligns with major sporting events in the region, such as Copa América 2024, the NFL game in Brazil, and the NBA game in Mexico, as well as global events like the Paris 2024 Olympic Games. The higher CPA in the Finance category can be attributed to the growing popularity of cryptocurrency and fintech services in LATAM. Brazil and Mexico serve as the region’s primary fintech hubs, hosting 23.53% and 20.14% of all fintech companies, respectively1. In 2024, fintech companies in the region raised $2.37 billion in funding2, which likely contributed to increased advertising competition.
- Latam Fintech Ecosystem 2024: Insights from the Finnovista and IDB Report
- Brazil dominated the LATAM FinTech market as Brazilian companies raised half of all deals in 2024
In December 2024, Apple Search Ads expanded to Türkiye and 20 additional countries across the EMEA and Asia regions. Among these new markets, Türkiye stands out as the largest economy by GDP in 2023, according to World Bank data. It ranks as the 17th largest economy globally, with a population of 85.33 million.
Following the Apple Search Ads expansion, advertisers using SplitMetrics Acquire launched over 5,500 campaigns in these new markets within the first month. Türkiye, Luxembourg, Estonia, Slovakia, and Cyprus led in campaign volume, highlighting early adoption trends.
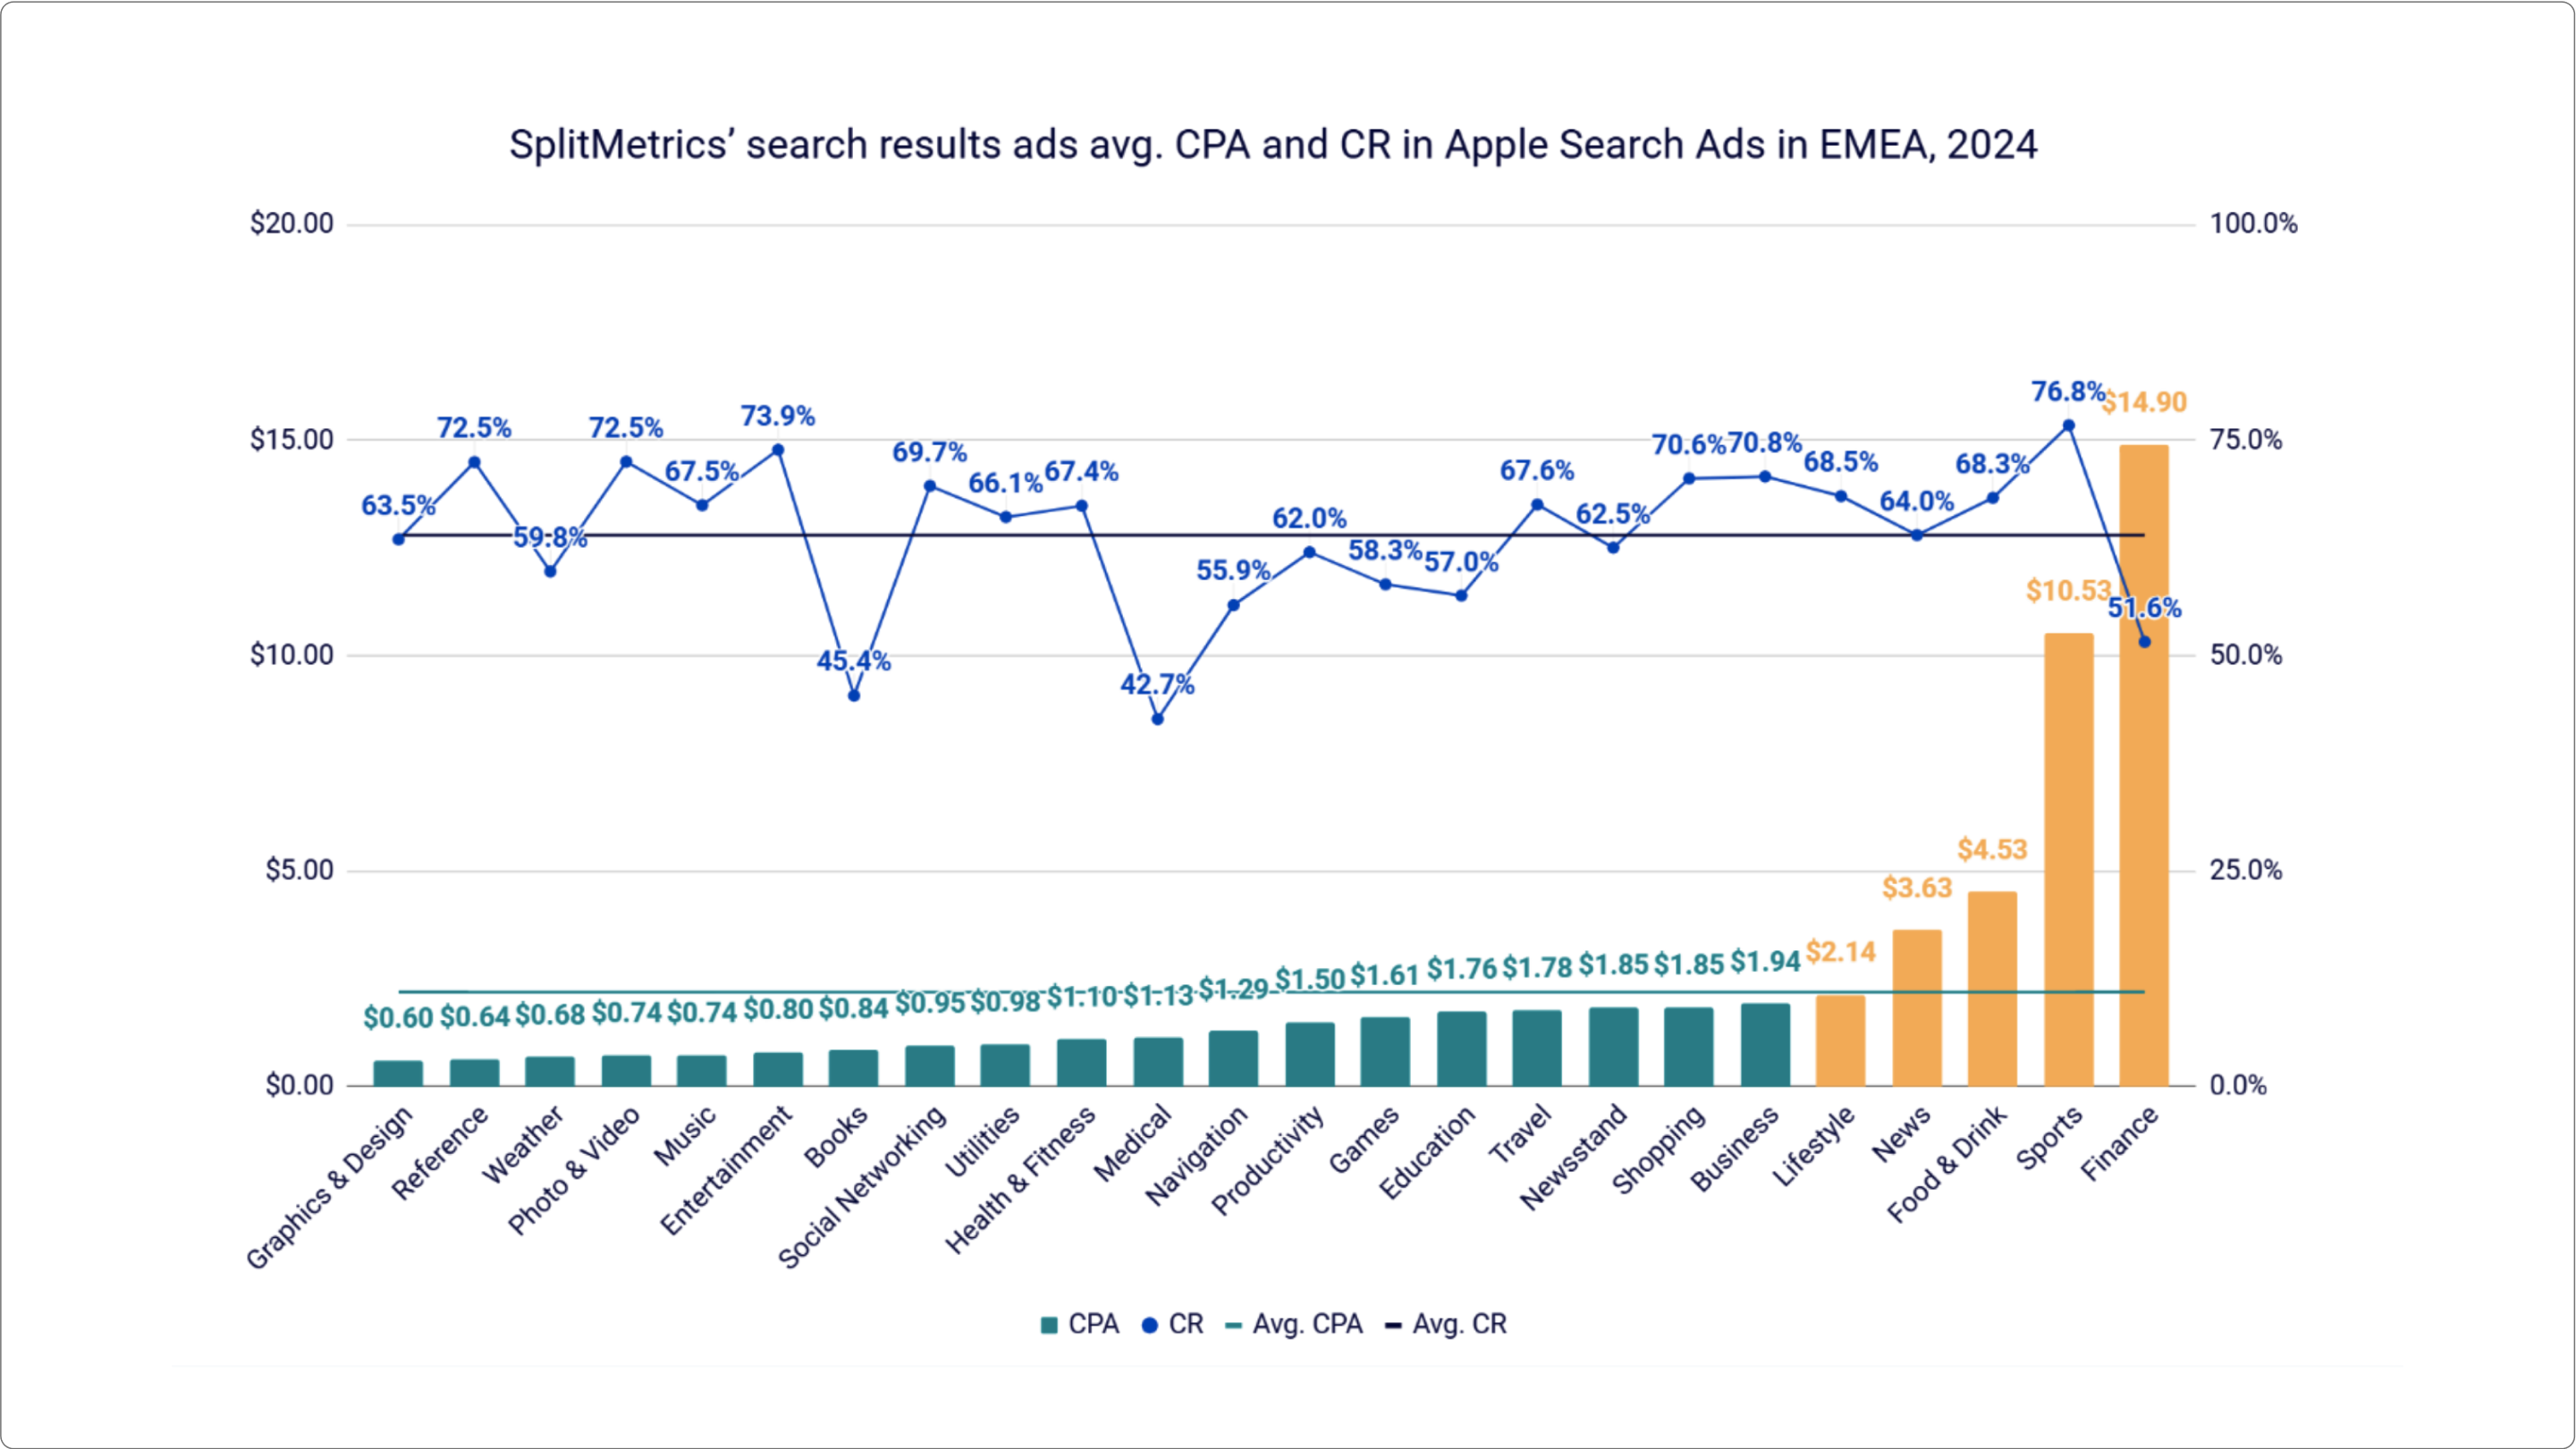
In the EMEA region in 2024, the top five app categories by CPA were Finance ($14.90), Sports ($10.53), Food & Drink ($4.53), News ($3.63), and Lifestyle ($2.14), reflecting high competition in these verticals.
The finance category often has high CPAs due to strong competition among banks, fintech apps, and investment platforms. In 2024, rising interest in digital banking, cryptocurrency, and investment tools likely contributed to increased advertiser spending.
Major sporting events, such as EURO 2024 and the Paris Olympics, likely drove higher ad investments from sports betting apps, streaming services, and fitness-related brands, increasing competition and, as a result, raising CPAs.
The continued rise of food delivery services, grocery apps, and restaurant booking platforms in EMEA contributed to high competition. Seasonal spikes, such as the holiday season and local food festivals, may have further increased advertising costs.
Growing digital media consumption, especially around political events, economic developments, and major sports tournaments, may have driven higher demand for news apps. Advertisers likely competed aggressively to capture engaged audiences during peak news cycles.
The lifestyle category includes a wide range of apps, from wellness and fitness to fashion and personal development. The increasing focus on self-care and digital lifestyle solutions, coupled with rising consumer spending in these areas, likely contributed to higher acquisition costs.
While these metrics may seem high compared to other channels, leveraging Apple Search Ads automation solutions like SplitMetrics Acquire can help attract high-LTV users and maximize ROAS (return on ad spend).
– Lidiia Mylenka, Marketing Manager at SplitMetrics
Dynamic Preloads
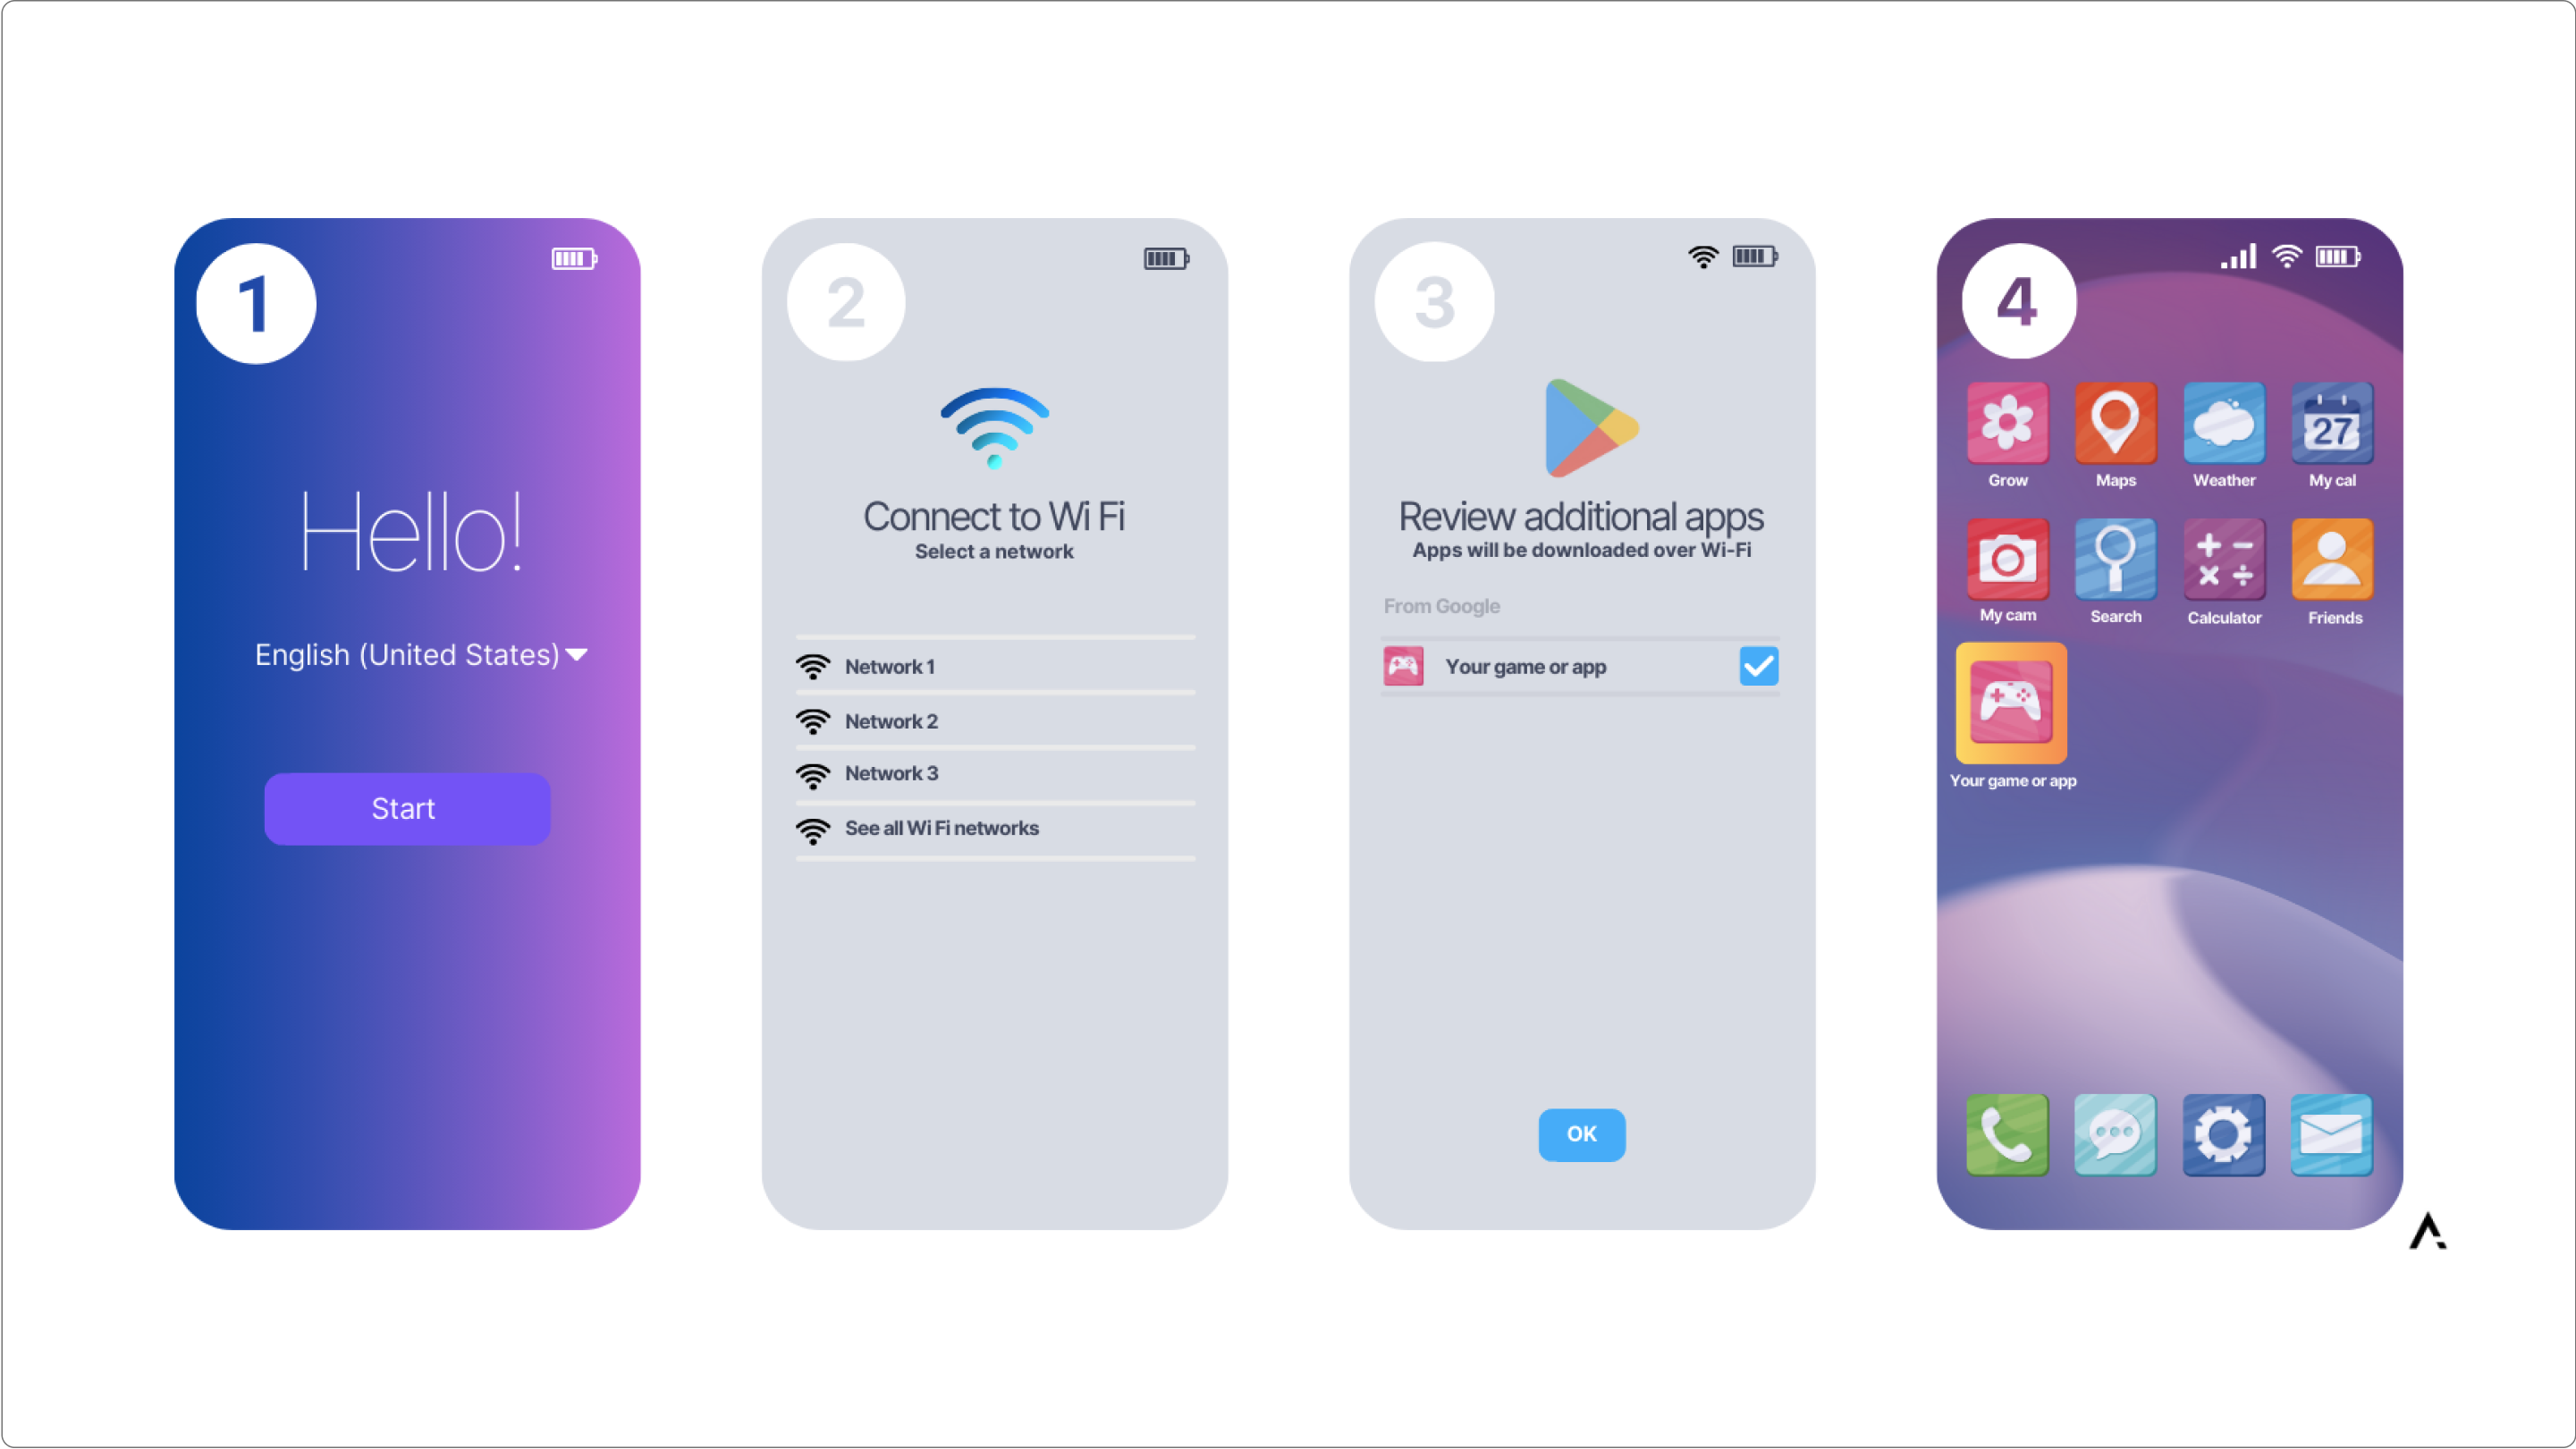
As app marketers seek innovative ways to enhance user acquisition, Dynamic Preloads have emerged as a powerful solution for increasing both non-organic and organic app installs. By leveraging partnerships with mobile OEMs, Dynamic Preloads gets apps directly onto new devices during the setup process, ensuring unparalleled visibility and user engagement.
The power of Dynamic Preloads
Dynamic Preloads, delivered through Google Play Auto Install (PAI), capture user attention at a critical moment—when they are setting up their new device. Your app is presented to the user during setup and installed upon user consent. This user consent is crucial, as it tends to indicate that those who opt-in to install the app are more likely to use, spend, and engage with it.
Unlike traditional factory preloads, which often include outdated app versions, Dynamic Preloads ensure users receive the latest app version directly from the Google Play Store. No more fumbling around with app updates. This process enhances the user experience and boosts app adoption rates. Additionally, by operating on a Cost-per-stall (CPI) model, Dynamic Preloads provide marketers with a cost-effective, flexible approach to user acquisition.
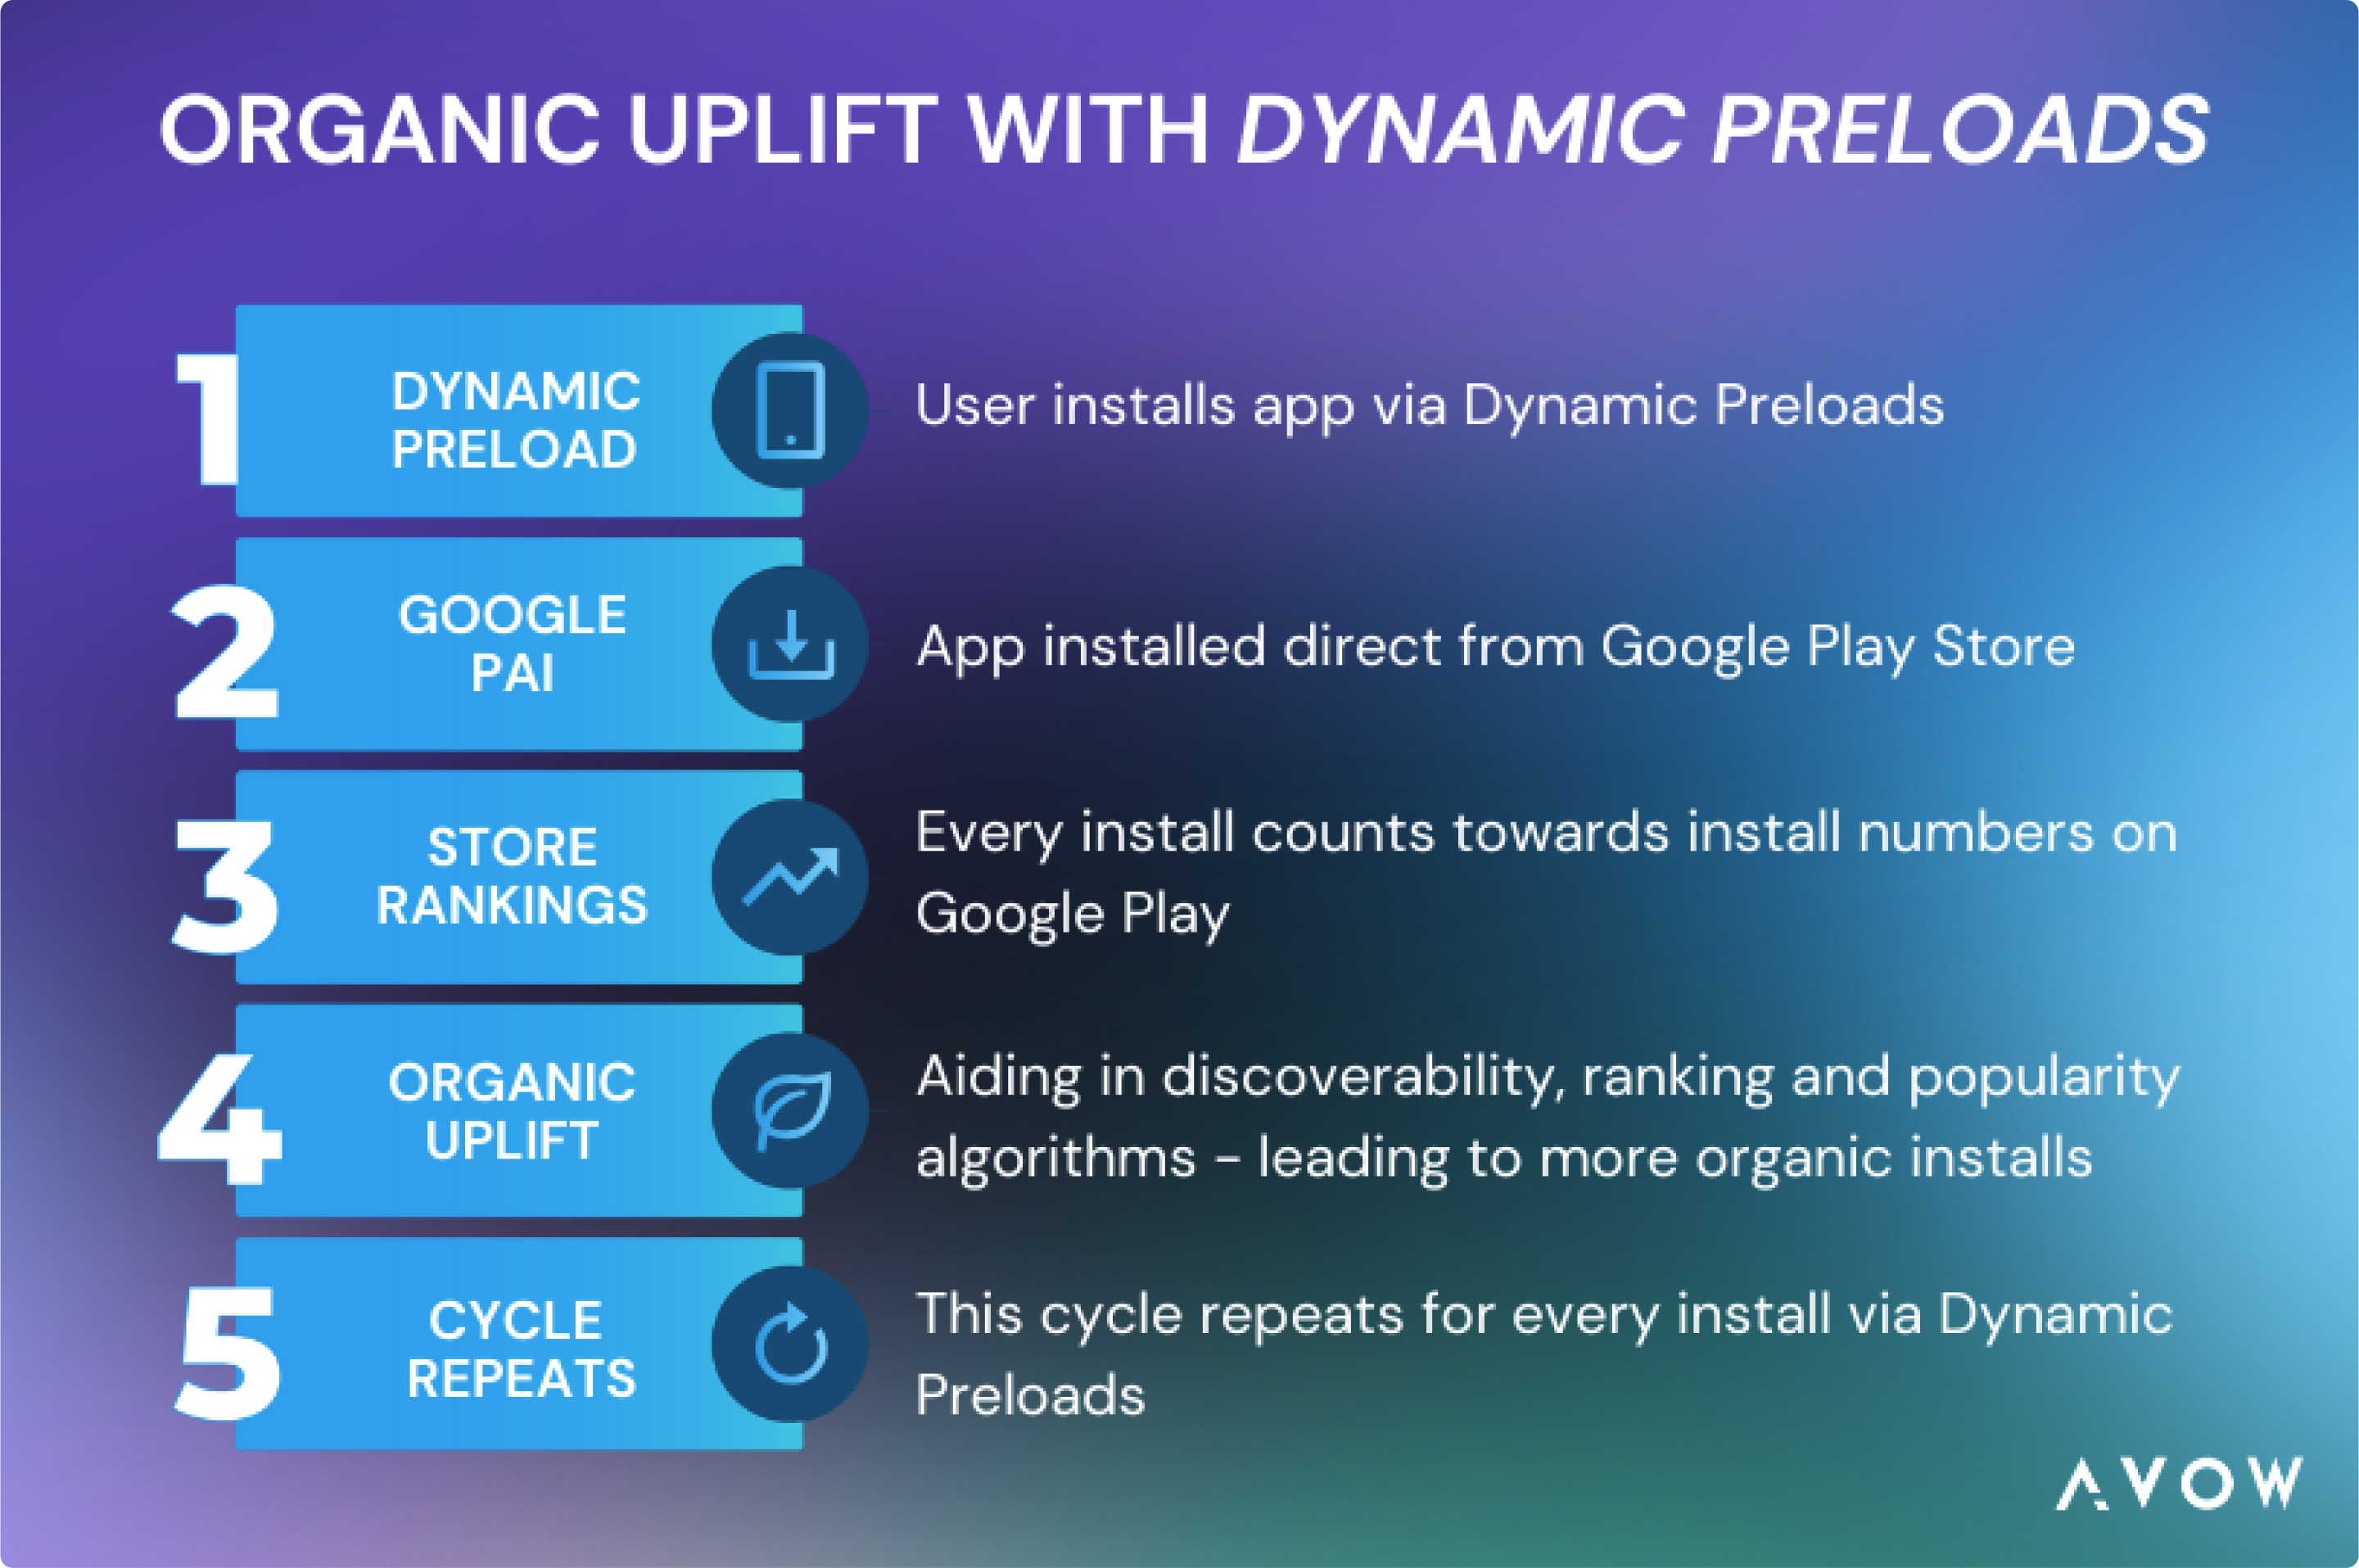
Organic uplift: a complementary advantage
One of the standout benefits of Dynamic Preloads is their ability to drive organic uplift. As non-organic installs through preloads increase, the app’s visibility in the Google Play Store improves, leading to higher app store rankings. This heightened visibility generates a snowball effect, attracting organic users who discover the app through improved discoverability. For app marketers, this dual benefit translates into more efficient use of marketing budgets, combining immediate reach with long-term organic growth.
Data-backed success
Through analysis of our internal data as part of crafting our industry guides on Dynamic Preloads and Organic Uplift, here are some key numbers:
- On average, clients have seen a 1000% increase in installs with Dynamic Preloads.
- This success is so evident and transformative that 90% of clients re-invest in Dynamic Preloads within 3 months of the previous campaign.
- The organic uplift experienced with Dynamic Preloads is undeniable. Clients experience an average increase in organic installs by 48% across both gaming and non-gaming verticals.
- When accounting for installs with both Dynamic Preloads and the organic uplift, clients have seen up to a 1400% increase in installs during the campaign period.
Recommendations for app marketers
To maximize the impact of Dynamic Preloads:
- Target high-growth regions: Partner with OEMs popular in both developed and emerging markets to reach untapped user bases.
- Optimize campaign timing: Align Dynamic Preload campaigns with seasonal or regional trends to enhance relevance and engagement.
- Incorporate retargeting strategies: Engage users who have installed the app but may not be as active with personalized offers or reminders.
App marketers can achieve scalable user acquisition by integrating Dynamic Preloads into their marketing mix. This ensures both immediate visibility and builds a foundation for long-term success in an increasingly competitive app ecosystem. Contact our A-Team to learn more about Dynamic Preloads and mobile OEM advertising. Alternatively, take a look at our industry guides, which cover everything you need to know about mobile OEM advertising, alternative app stores, Dynamic Preloads, and more.
“Dynamic Preloads are transforming the way app marketers approach user acquisition. By getting apps directly in front of users during setup, we’re not just driving installs—we’re building a foundation for long-term organic growth. This strategy ensures that every campaign delivers immediate impact and sustained value in an increasingly competitive mobile ecosystem.”
Robert Wildner
CEO & Co-Founder of AVOW
“Thanks to AVOW’s leveraging of Google PAI preloads, we’ve seen some great successes since our partnership began. AVOW’s innovative approach allows us to access preloads on OEM devices with remarkable ease, streamlining and simplifying a high-quality acquisition channel. The results are speaking for themselves, and we’re excited about the growth opportunities that lie ahead.”
Euan Cowen
Marketing Manager (User Acquisition), Tripledot Studios
“AVOW helped us cut user acquisition costs significantly while delivering consistent organic growth. The combination of installs and long-term engagement was exactly what we needed.”
Kiran Babu
Founder, Funvent Studios
“The collaboration with AVOW and their OEM partners allowed us to reach users we could never have accessed through traditional app stores. Dynamic Preloads have been instrumental in driving our growth.”
Luciano Rodriguez
Senior Acquisition User Manager, MobilityWar

Robert Wildner
CEO & Co-founder, AVOW

Programmatic for full-screen ads
Fullscreen ad placements provide one of the most engaging creative experiences within mobile advertising. Features such as double endcards and SKOverlay make them essential to leverage in any app performance campaign, while its naturally high viewability rate and possibility to incorporate interactive elements make it an invaluable asset for brands looking to effectively reach their audience.
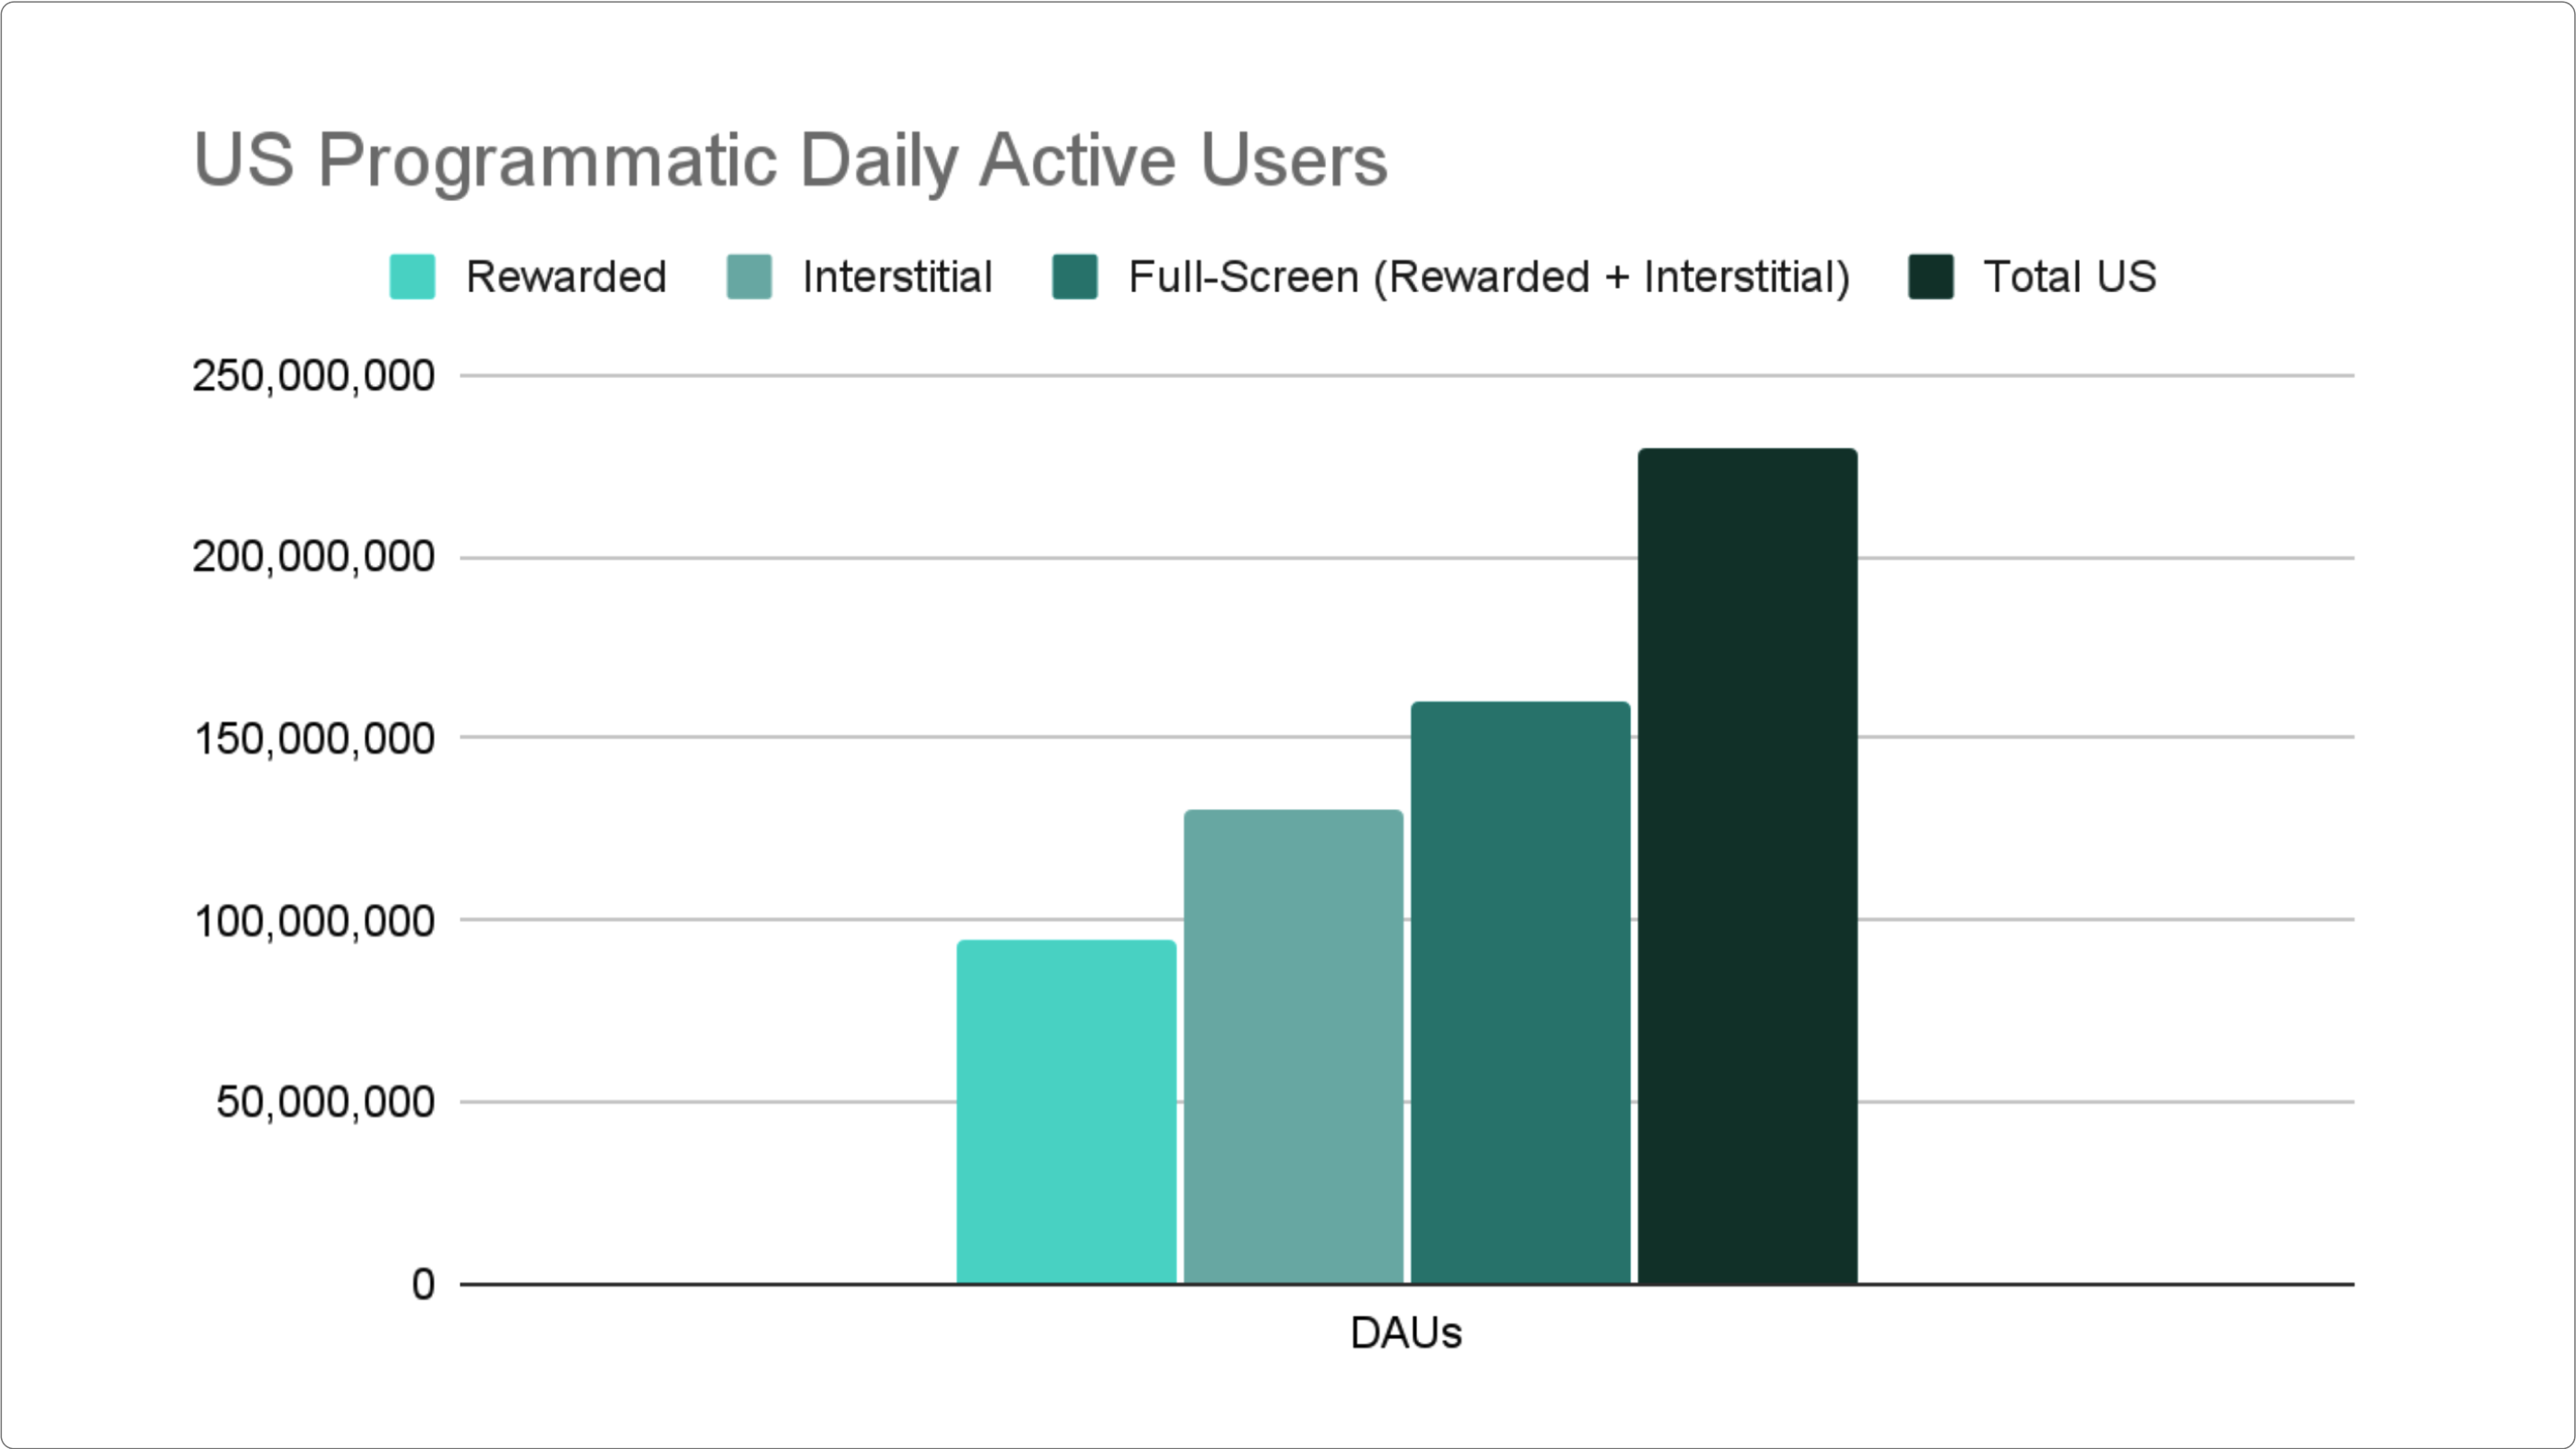
Programmatic currently provides transparent, controlled access to 230 Million App Daily Active Users in the US, with FullScreen Ads, i.e. Rewarded Video and Interstitials, granting a high engagement medium to effectively impact 70% of those users (160 Million).
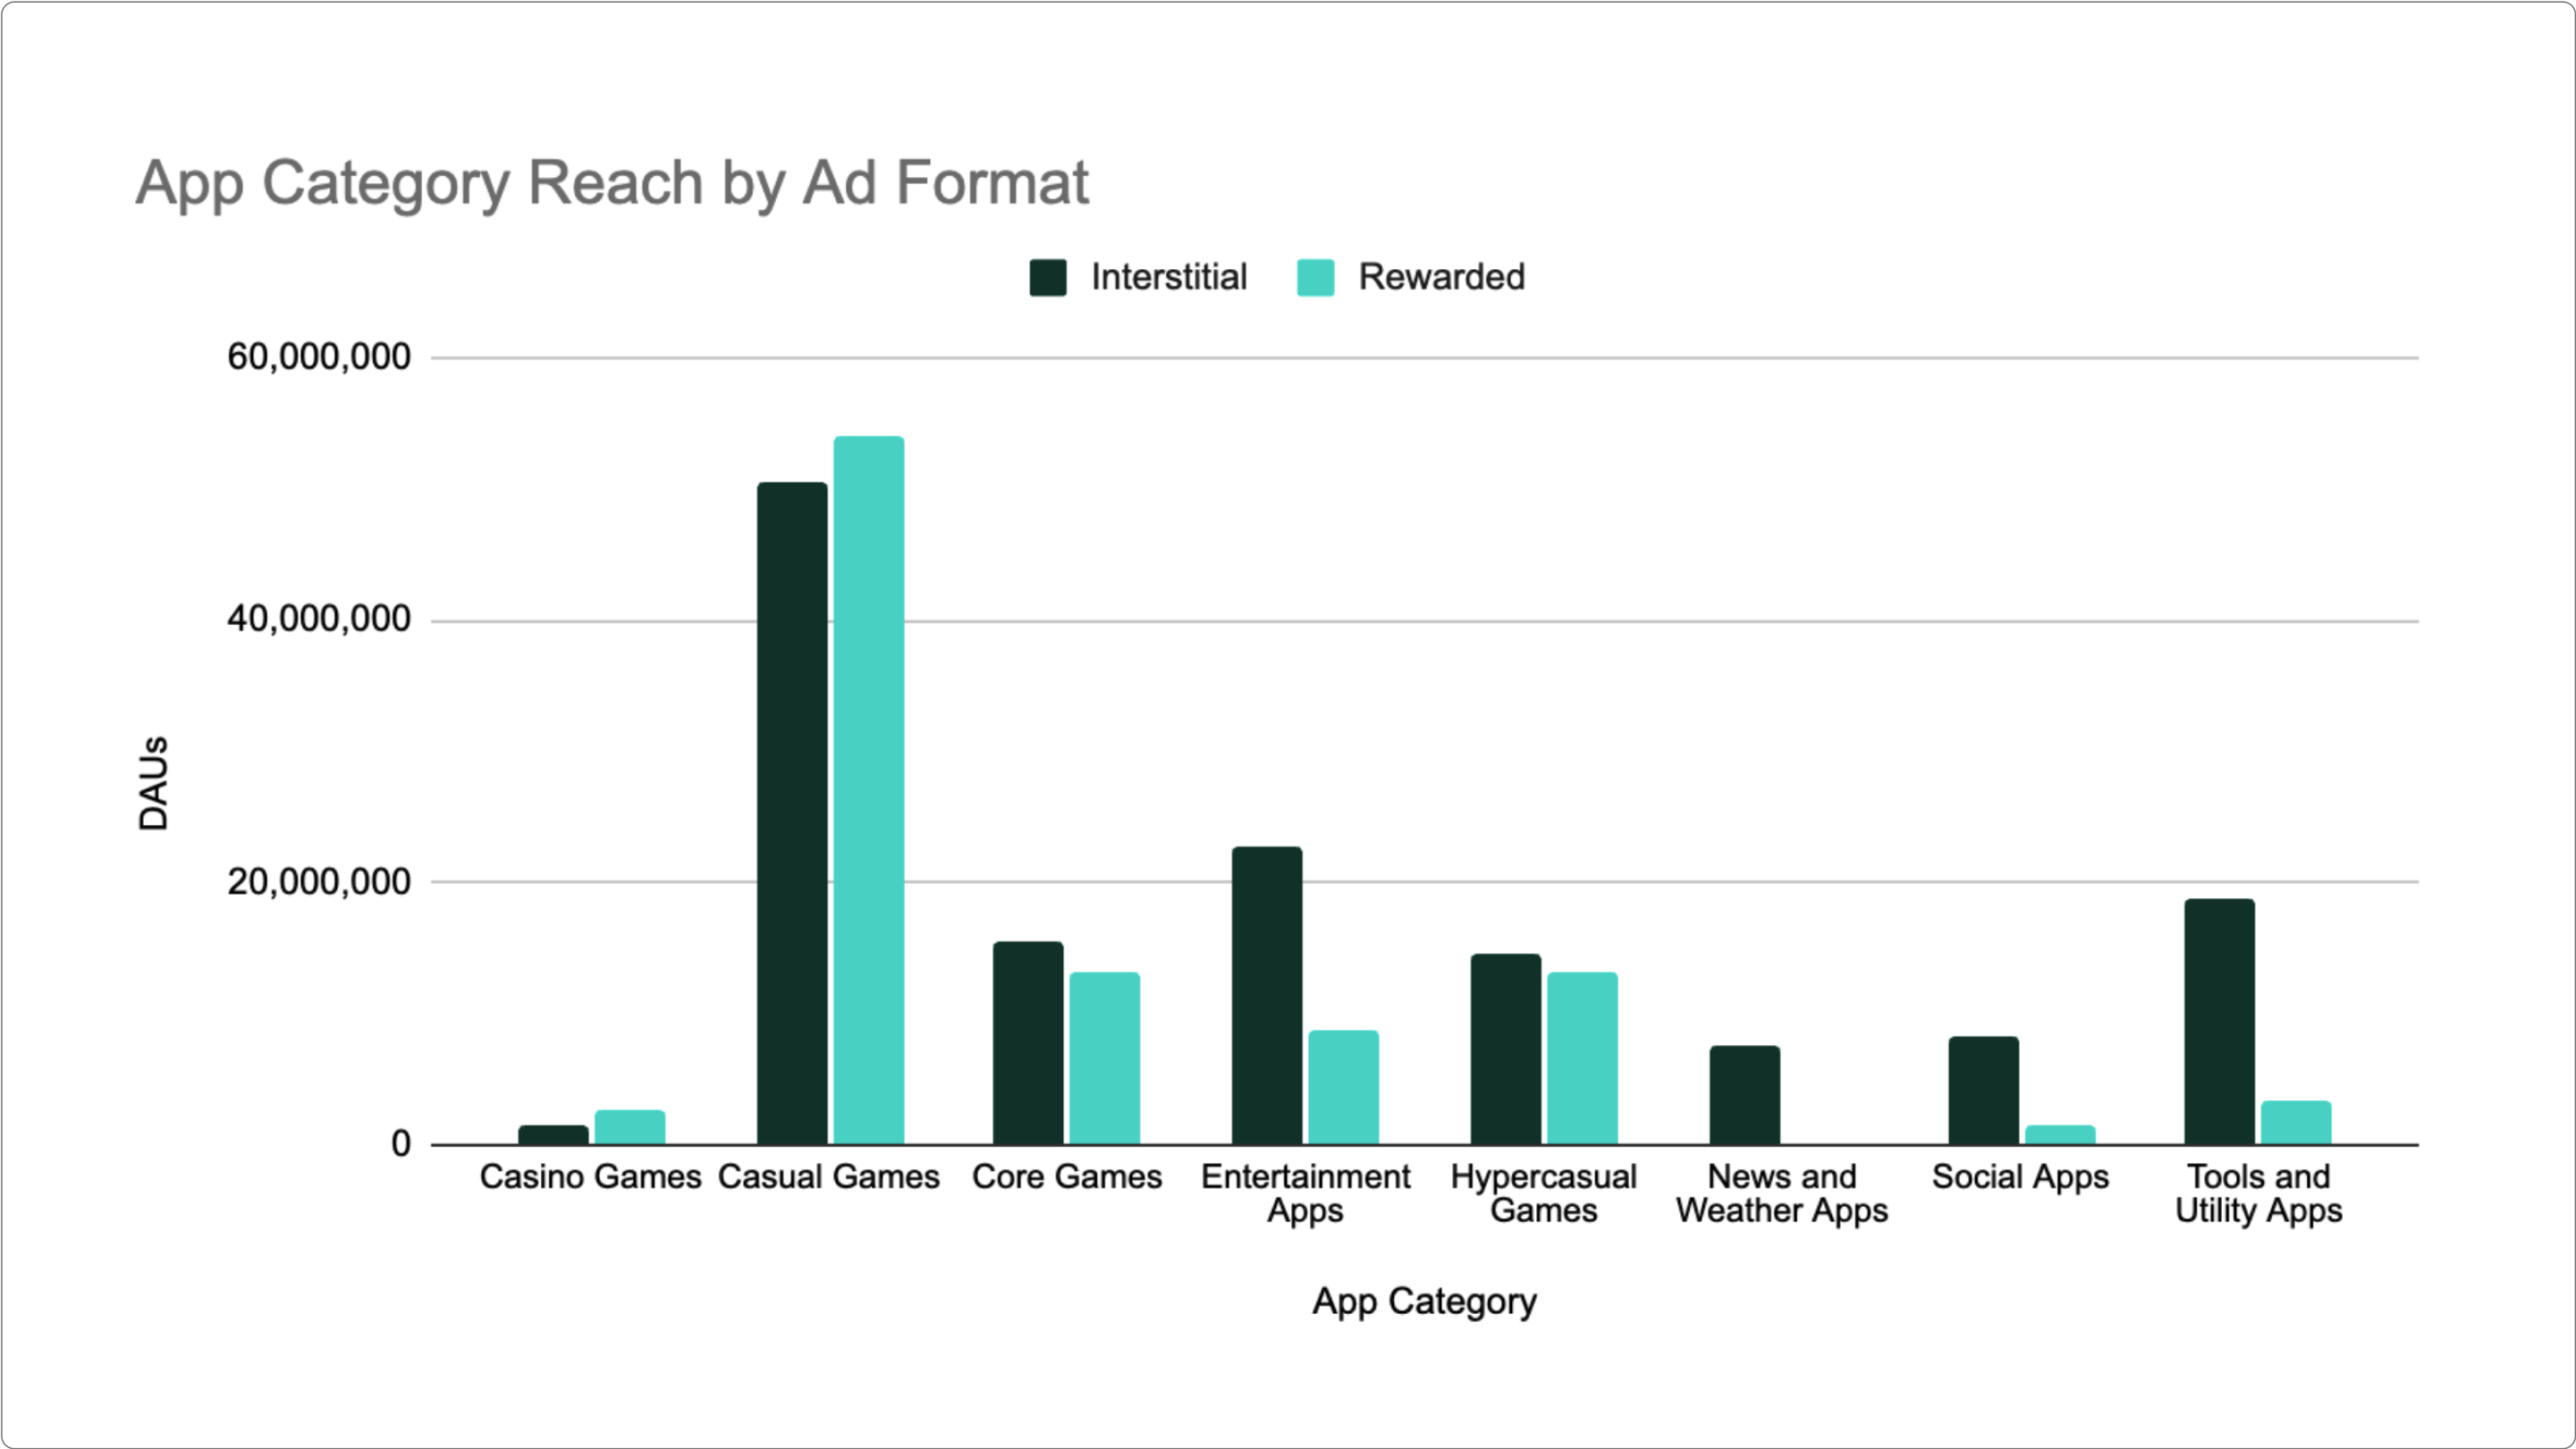
Leveraging Full-Screen ad formats will guarantee significant reach across key gaming categories, such as Casual Games, Core Games and HyperCasual Games. If only focusing on Rewarded, marketers will lose access to valuable audiences present on non-gaming apps, so considering Interstitials as well is essential to cover a fuller spectrum of apps and users.
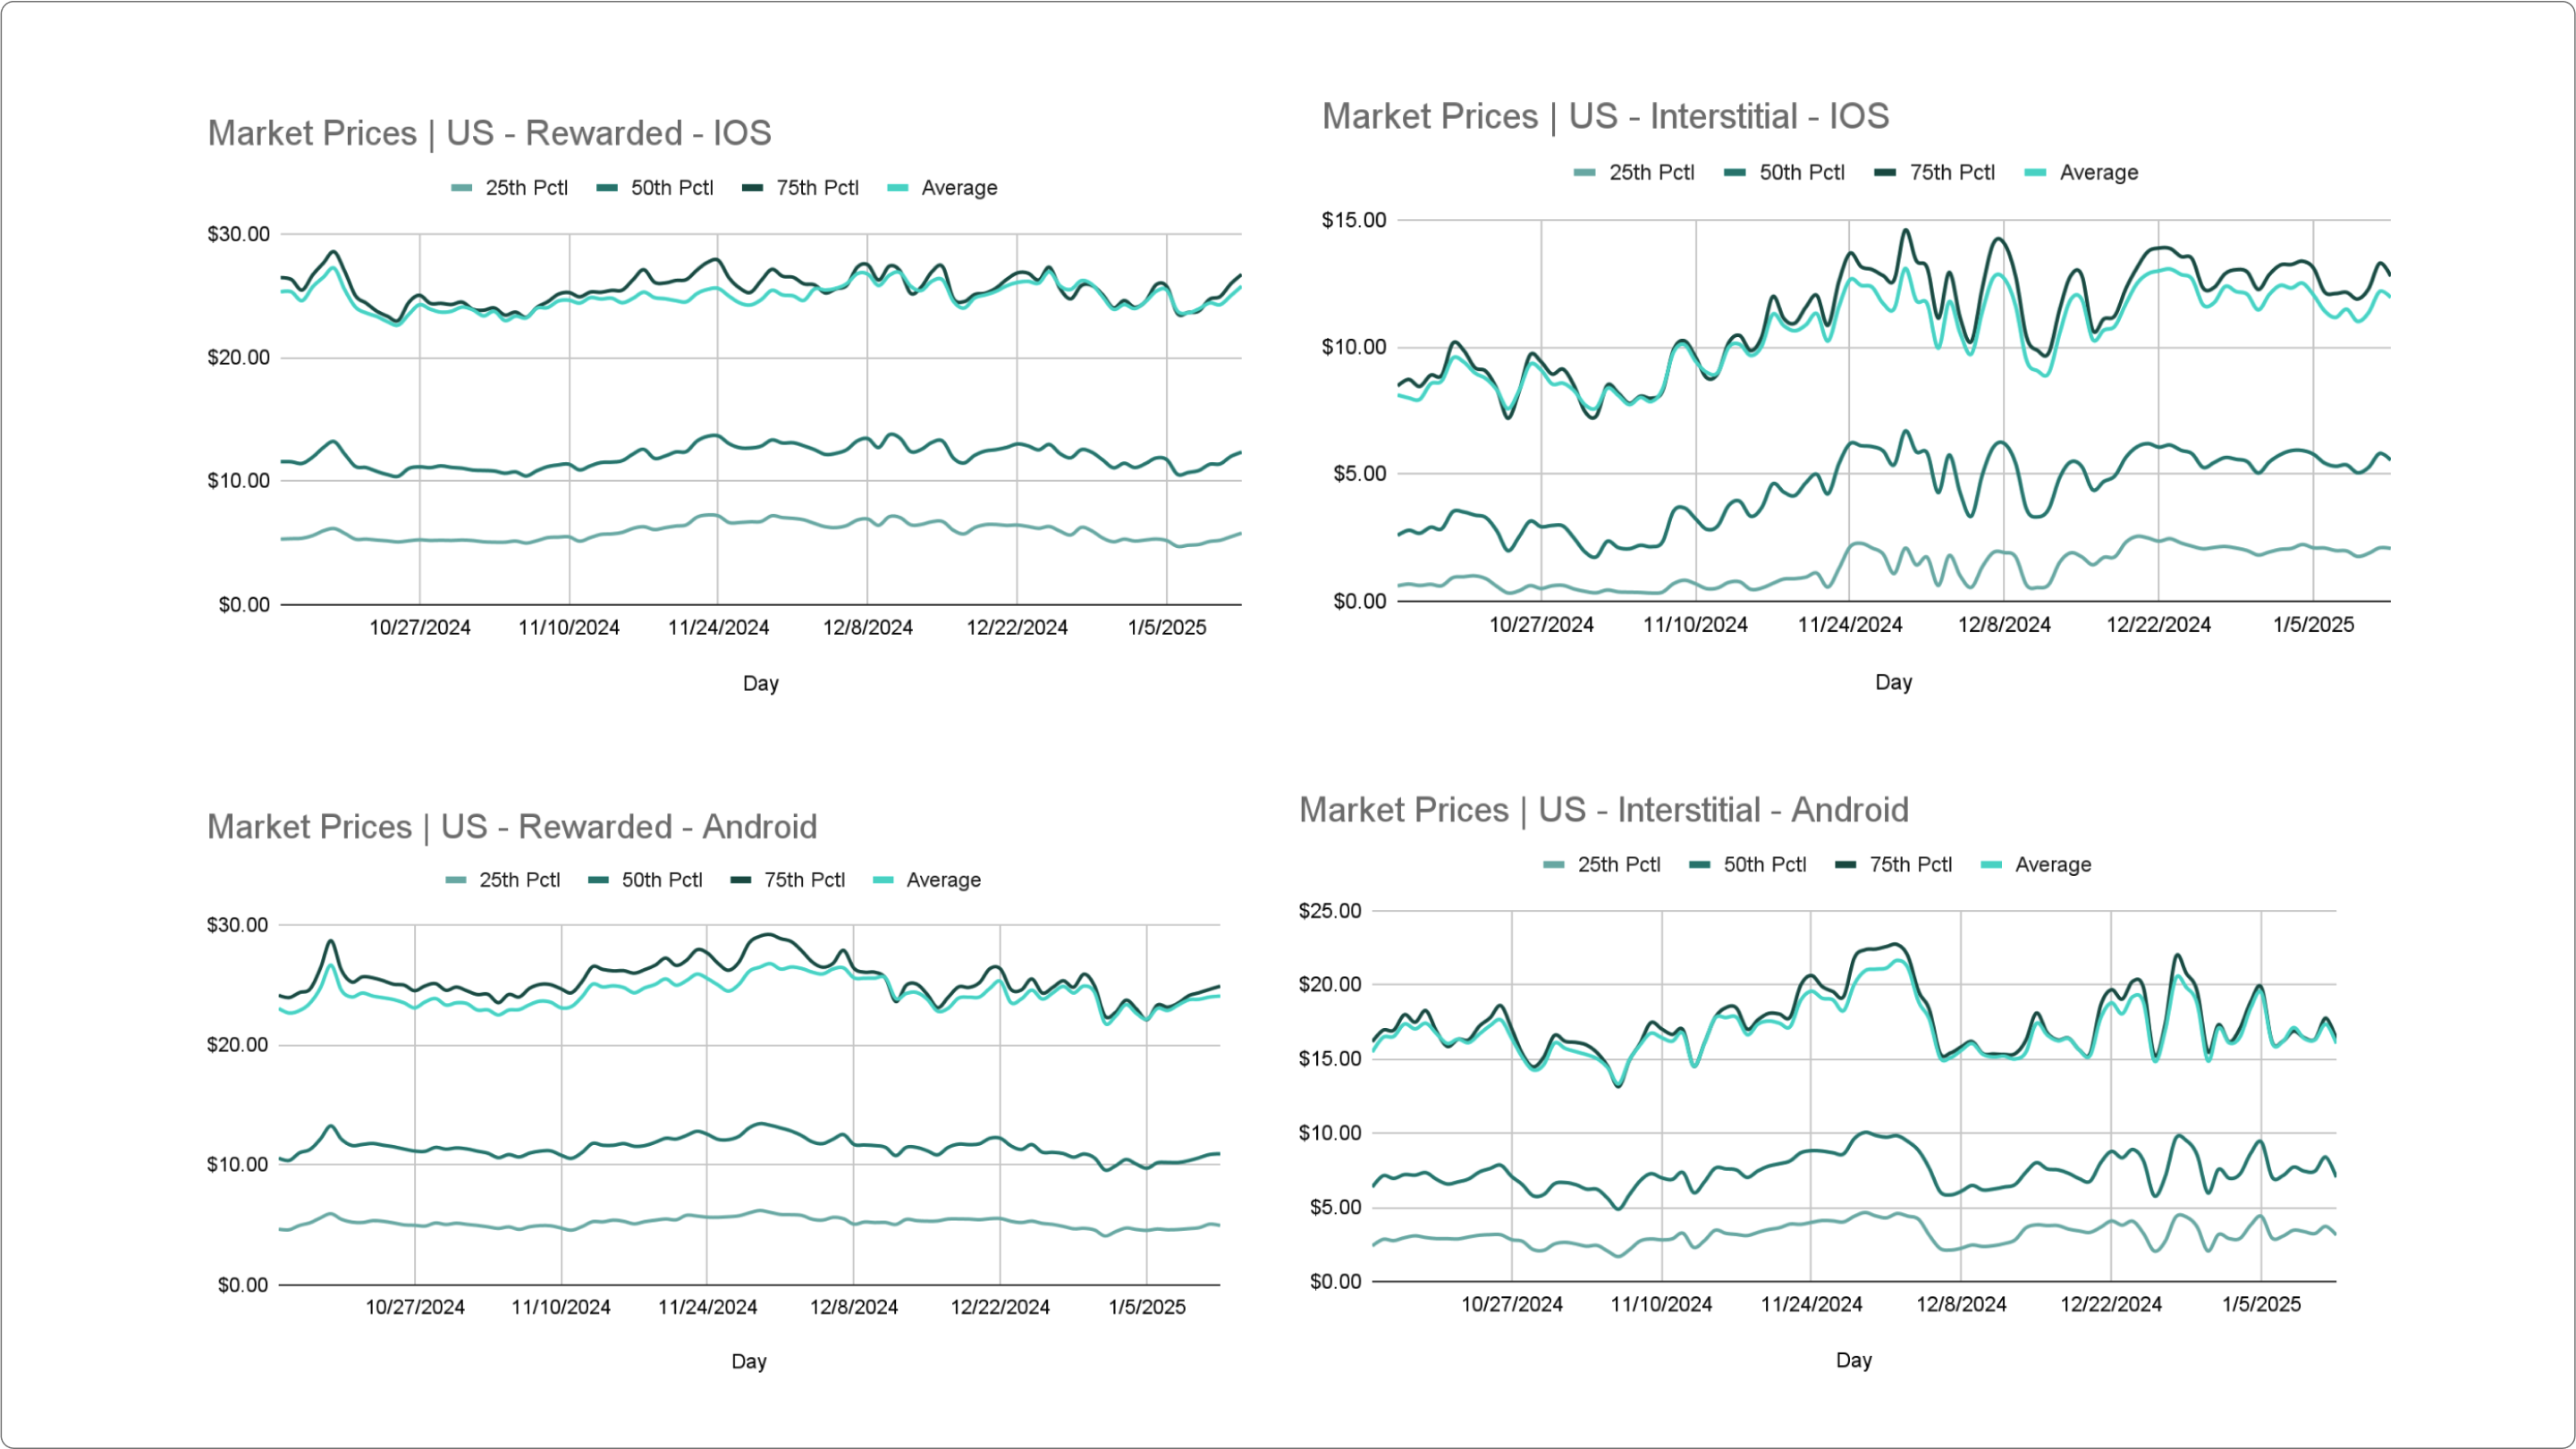
Programmatic market prices for Rewarded have been decreasing gradually since Black Friday, yet remain overall stable. On the other hand Interstitials, specially on iOS, have been increasing significantly in price and remain on the upper end even as we dive into Q1 2025.
It is worth noting that, in all cases, the Average Price very closely resembles the 75th percentile, i.e. 75% of all Full-Screen impressions are priced at or below the Average Price. This behavior is typical in a positive-skewed distribution, where the vast majority of impressions are on the left side, i.e. can be acquired at a more accessible price point, yet there is a long tail extending to the right, with certain Full-Screen impressions and users commanding premium prices. For example, in Rewarded iOS, the 95th percentile is consistently around $100 across the analyzed period.
By utilizing Programmatic for their campaigns in Q1 2025, marketers can take full advantage of the flexibility and high engagement offered by mobile Full-Screen ads. This approach ensures cost-efficient pricing and enables customized creative strategies, all the way down to the impression level.
AI in creative
The use of AI in creative strategy and production will get much more sophisticated in 2025.
Early tools like GPT, MidJourney, and AI avatars simplified content creation, making it easier and faster to produce ads and assets. However, the results often lacked depth and polish, with outputs that were clearly AI-generated and, in many cases, failed to resonate with audiences.
That basic approach just doesn’t perform anymore. The landscape is shifting toward smarter, more strategic applications of AI, where success depends on combining human creativity with AI-driven insights.
It’s not enough to accept whatever AI produces at face value. Instead, we’re seeing savvy marketers and strategists take a more active role, using AI as a powerful tool to enhance, refine, and optimize creative outputs.
For example, our internal tool BruteForce.AI dives deep into ad performance, analyzing scripts, visuals, and even individual frames to uncover what truly works. This level of granular insight empowers teams to fine-tune their messaging, visuals, and strategy, ensuring campaigns connect with audiences in meaningful ways. It’s a shift from blindly relying on AI to thoughtfully integrating it into every stage of the creative process.
The “let’s just use whatever AI gives us” mindset is being replaced by a more deliberate, hybrid approach, where AI augments, but doesn’t replace human expertise.
Creative strategists who embrace this balance are already driving better performance.
As we move into 2025, this kind of thoughtful AI integration will likely become the norm, redefining what “good creative” means and raising expectations for quality and effectiveness across the board.
I see the bar being much higher for smart AI use in creative strategy.
– Shamanth Rao, CEO, RocketShip HQ
All insights are based on anonymized and aggregated data. In addition, each category has been checked for statistical reliability.