Table of contents
- A shifting mobile world
- High-level: what changed in Q2
- Global mobile at a glance
- ATT opt-in rates
- Cost per install: global
- Regional CPI, CTR, CVR: top countries
- Ad networks & platforms: top gainers
- Ad spend growth and decrease by country
- Hottest genres with the most downloads: global
- Key metrics by vertical
- Platform share: iOS, Android, web
- Paid vs organic installs
- Partner contributions: SensorTower, Alison.ai, Splitmetrics, Persona.ly, Mobvista

Available in: English, Korean, Portuguese, Spanish & Chinese
A shifting mobile world
The world is changing. Slowly, via the EU’s Digital Markets Act and similar legislation around the world, we’re seeing the early beginnings of a multi-platform, more open computing ecosystem on mobile.
It’ll take years to get there, of course.
Believe it or not, we’re even seeing the early emergence of national privacy legislation in the U.S. And that will take years to develop as well.
But it’s clear that change is coming.
At the same time as app stores are beginning to open, some national boundaries are closing. China, Russia, India, and other countries across the world are exerting more control over what apps publishers can offer in their countries. You might even be able to include the U.S. in this list, as we see with TikTok.
In and around all this macro-level change, SKAN is transitioning to AAK. Privacy Sandbox is continuing to develop, and soon device IDs could become scarce on both major platforms … even if the GAID follows the third-party cookie in avoiding complete deprecation.
Through it all, marketers have to continue to climb the growth mountain. We hope this Quarterly Trends Report is of some assistance as you ascend!
High-level: what changed in Q2
- ATT opt-in on iOS dropped 13% from Q1
- Organic installs increased on Android; decreased on iOS
- CPI shifts
- Android apps: 16% more expensive
- Android games: 8% cheaper
- iOS apps: 7.4% cheaper
- iOS games: 6% more expensive
- Ad network gainers include 2 CTV-focused networks
- Blisspoint
- Roku
- Casual games, or hybrid casual games, continue to grow at the expense of hyper casual games
- CTRs increased for games and decreased for apps
- Ad spend shifted slightly to iOS from Android
- Organic installs increased on Android
Data in this report is based on a significant slice of Singular’s data:
Global mobile at a glance
As of Q2 2024, here’s the state of the mobile world:

In-app spending is also growing in 2024, joining mobile advertising in providing huge monetization opportunities for mobile publishers.
Globally, 2.71 billion people are now shopping online.
ATT opt-in rates
Overall ATT opt-in
Opt-in rates dropped sharply again in Q2 2024 from the previous quarter.
Last quarter the rate dropped 16% to a 15.83% yes. This quarter the yes rate dropped another 12.5% to an overall yes rate of just 13.85%: very low indeed.
Note: this is based on apps that ask for ATT permission immediately upon download. It’s important to remember that this rate can and does grow. Many apps do not request tracking permission immediately, so the percentage can grow over time.
ATT opt-in: gaming vs non-gaming
The gap between games and apps for initial ATT ask-and-accept is growing.
- In Q4 2023, the gap was just 1%
- In Q1 2024, the gap grew to 4.1%
- In Q2 2024, the gap expanded again to 6.67%
Games are much more likely to get an immediate positive response to the ATT prompt, and this is increasingly true. 18.58% of games that asked for ATT permission upon download got a yes, while only 11.92% of apps did.
ATT opt-in by gaming verticals
There is a significant amount of diversity in ATT opt-in rates across different verticals.
Music games hit 35% yes, while Adventure, Card, and Simulation games were all in the 24-25% range. Casino and Trivia games, by contrast, were both sub-10%.
Note: educational games for children cannot request tracking permission.
ATT opt-in by non-gaming verticals
Weather apps still get an amazingly high yes rate for ATT at 38%, but it’s not as high as in Q1, when it was almost 45%.
Art & Design as well as Food & Drink are high as well, along with Maps & Navigation.
ATT double opt-in
App Tracking Transparency requires double opt-in: a yes on the publisher app that is displaying an ad, and a yes on the advertiser app that the ad is for. This is why you need a high ATT “yes” rate.

Note:
If you’re way above average and getting 40% on both sides, 16% of your installs are now trackable. That’s small, but at scale it’s a significant percentage which you can use as modeling guidance for your overall ad spend and optimization.
Even 10% could be enough, or 5% with sufficient volume.
Cost per install: global
Android games
- Global CPI: $0.67 ⬇️ $0.06
- Global CTR: 3.34% ⬆️ .11 percentage points
- Global IPM: 4.59 ⬆️ 1.05
Global CPI is slightly down, while CTR is up and installs per thousand ad impressions is also up (almost 20%, in fact).
Thanks to their high monetization rates, Casino games are the most costly, at $5.36. That’s followed by Card games at $3.58.
Android non-gaming
- Global CPI: $0.50 ⬆️ $0.07
- Global CTR: 2.43% ⬇️ .64 percentage points
- Global IPM: 4.58 ⬆️ .29
As in Q1, fintech is still at the top of the leaderboard in terms of CPI for Android, but prices are up from $1.62 to $1.71. That follows a general trend of increasing CPIs for Android in Q2 of 2024.
Retail has bounced up from $0.83 per install globally to $1.19.
The notoriously hard to monetize Health & Fitness category is cheap at just 4 cents per install, while Food & Drink installs cost the same as Retail.
iOS games
- Global CPI: $2.90 ⬆️ $0.16
- Global CTR: 4.27% ⬆️ .19 percentage points
- Global IPM: 0.78 ⬇️ .02
CPI for iOS games is up slightly in Q2 2024.
More interestingly, however, look at how much more adblind iOS users are than Android users. Android IPMs for games are typically in the 4-5 range. iOS IPMs, on the other hand, are typically around 1 for games: a massive delta.
To get a bit more into the weeds, CPIs for the most expensive gaming category, Family games, were way down in Q2, dropping from over $12 to $7.32. Board games were also down, sinking from $9.80 to $6.94.
iOS non-gaming
- Global CPI: $0.75 ⬇️ $0.06
- Global CTR: 3.01% ⬇️ .1 percentage point
- Global IPM: 4.04 ⬆️ .44
Fintech apps were again the most expensive installs to buy in Q2, but did get cheaper, dropping to $2.85 from $3.52 in Q1. That continues a trend, since fintech CPIs averaged $3.98 in Q4 of 2023.
Family apps were expensive at a global average of $2.29, as were Sports, Productivity, and Entertainment apps.
Regional CPI, CTR, CVR: top countries
| Country | CPI | CTR | CVR |
|---|---|---|---|
| Aruba | $0.55 | 3.56% | 37.05% |
| Afghanistan | $0.03 | 5.26% | 28.10% |
| Angola | $0.07 | 4.76% | 67.80% |
| Anguilla | $1.00 | 3.87% | 32.84% |
| Åland Islands | $0.02 | 3.14% | 48.81% |
| Albania | $0.07 | 7.75% | 24.90% |
| Andorra | $0.27 | 4.26% | 41.21% |
| United Arab Emirates (the) | $0.29 | 2.94% | 36.91% |
| Argentina | $0.15 | 1.60% | 29.00% |
| Armenia | $0.05 | 7.54% | 34.43% |
| American Samoa | $0.44 | 1.96% | 34.24% |
| Antarctica | $0.02 | 1.05% | 290.00% |
| French Southern Territories (the) | $0.03 | 1.86% | 100.00% |
| Antigua and Barbuda | $0.07 | 3.66% | 41.86% |
| Australia | $1.04 | 2.17% | 33.78% |
| Austria | $0.63 | 2.63% | 26.45% |
| Azerbaijan | $0.02 | 7.30% | 44.01% |
| Burundi | $0.04 | 4.41% | 29.23% |
| Belgium | $0.52 | 2.07% | 32.97% |
| Benin | $0.04 | 5.72% | 33.03% |
| Bonaire, Sint Eustatius and Saba | $0.07 | 4.35% | 35.07% |
| Burkina Faso | $0.36 | 5.55% | 7.91% |
| Bangladesh | $0.01 | 7.56% | 26.78% |
| Bulgaria | $0.13 | 2.79% | 30.81% |
| Bahrain | $0.07 | 4.41% | 44.75% |
| Bahamas (the) | $0.52 | 3.17% | 47.01% |
| Bosnia and Herzegovina | $0.05 | 4.68% | 36.20% |
| Saint Barthélemy | $0.94 | 0.86% | 18.30% |
| Belarus | $0.03 | 6.22% | 38.93% |
| Belize | $0.09 | 4.22% | 43.56% |
| Bermuda | $0.77 | 2.20% | 33.82% |
| Bolivia (Plurinational State of) | $0.03 | 5.46% | 37.10% |
| Brazil | $0.16 | 2.45% | 35.92% |
| Barbados | $0.19 | 4.24% | 36.69% |
| Brunei Darussalam | $0.07 | 5.38% | 31.00% |
| Bhutan | $0.03 | 2.69% | 34.34% |
| Botswana | $0.06 | 5.26% | 43.19% |
| Central African Republic (the) | $0.04 | 4.54% | 24.08% |
| Canada | $1.33 | 2.02% | 29.98% |
| Cocos (Keeling) Islands (the) | $0.02 | 3.16% | 121.74% |
| Switzerland | $0.82 | 2.95% | 26.29% |
| Chile | $0.27 | 1.42% | 33.30% |
| China | $0.01 | 78.50% | 19.38% |
| Côte d’Ivoire | $0.03 | 7.96% | 29.13% |
| Cameroon | $0.03 | 4.69% | 55.48% |
| Congo (the Democratic Republic of the) | $0.04 | 5.79% | 26.73% |
| Congo (the) | $0.03 | 5.36% | 39.27% |
| Cook Islands (the) | $0.14 | 2.54% | 27.46% |
| Colombia | $0.13 | 2.11% | 33.61% |
| Comoros (the) | $0.03 | 4.04% | 33.35% |
| Cabo Verde | $0.03 | 2.81% | 45.60% |
| Costa Rica | $0.11 | 2.15% | 55.86% |
| Cuba | $0.00 | 10.59% | 222.71% |
| Curaçao | $0.06 | 3.73% | 35.26% |
| Christmas Island | $0.02 | 4.63% | 52.94% |
| Cayman Islands (the) | $0.51 | 3.12% | 50.92% |
| Cyprus | $0.20 | 2.49% | 39.21% |
| Czechia | $0.22 | 2.94% | 30.11% |
| Germany | $0.91 | 1.82% | 30.49% |
| Djibouti | $0.03 | 6.83% | 33.93% |
| Dominica | $0.26 | 4.16% | 38.36% |
| Denmark | $1.02 | 1.81% | 21.10% |
| Dominican Republic (the) | $0.09 | 3.94% | 39.00% |
| Algeria | $0.01 | 8.63% | 25.29% |
| Ecuador | $0.04 | 3.73% | 47.98% |
| Egypt | $0.03 | 3.78% | 45.95% |
| Eritrea | $0.01 | 14.24% | 32.06% |
| Western Sahara | $12.45 | 3.52% | 0.18% |
| Spain | $0.71 | 1.31% | 23.31% |
| Estonia | $0.14 | 4.02% | 43.61% |
| Ethiopia | $0.04 | 7.03% | 30.03% |
| Finland | $0.56 | 1.48% | 36.53% |
| Fiji | $0.05 | 4.67% | 37.03% |
| Falkland Islands (the) [Malvinas] | $0.13 | 1.53% | 41.45% |
| France | $0.69 | 1.41% | 28.07% |
| Faroe Islands (the) | $0.17 | 2.43% | 27.00% |
| Micronesia (Federated States of) | $0.04 | 4.16% | 28.47% |
| Gabon | $0.02 | 4.64% | 63.50% |
| United Kingdom of Great Britain and Northern Ireland (the) | $1.26 | 1.53% | 27.29% |
| Georgia | $0.06 | 5.51% | 32.39% |
| Guernsey | $0.18 | 2.75% | 29.64% |
| Ghana | $0.15 | 3.70% | 30.79% |
| Gibraltar | $0.31 | 2.41% | 36.52% |
| Guinea | $0.03 | 10.91% | 9.82% |
| Guadeloupe | $0.13 | 2.19% | 42.27% |
| Gambia (the) | $0.09 | 4.47% | 28.79% |
| Guinea-Bissau | $0.13 | 4.44% | 33.97% |
| Equatorial Guinea | $0.06 | 4.34% | 29.91% |
| Greece | $0.35 | 2.52% | 25.45% |
| Grenada | $0.08 | 4.13% | 35.02% |
| Greenland | $0.18 | 1.43% | 29.52% |
| Guatemala | $0.06 | 4.81% | 40.38% |
| French Guiana | $0.07 | 3.37% | 41.53% |
| Guam | $0.40 | 2.29% | 28.57% |
| Guyana | $0.09 | 5.68% | 36.48% |
| Hong Kong | $0.26 | 2.45% | 77.34% |
| Honduras | $0.05 | 4.37% | 38.74% |
| Croatia | $0.18 | 4.43% | 41.97% |
| Haiti | $0.03 | 6.36% | 36.15% |
| Hungary | $0.24 | 2.52% | 27.48% |
| Indonesia | $0.05 | 3.71% | 28.39% |
| Isle of Man | $0.36 | 2.99% | 28.15% |
| India | $0.09 | 2.54% | 23.10% |
| British Indian Ocean Territory (the) | $0.10 | 3.46% | 60.05% |
| Ireland | $0.69 | 1.56% | 34.45% |
| Iran (Islamic Republic of) | $0.00 | 9.47% | 114.49% |
| Iraq | $0.01 | 14.40% | 18.63% |
| Iceland | $0.51 | 3.55% | 36.93% |
| Israel | $0.22 | 3.43% | 40.33% |
| Italy | $0.60 | 1.61% | 24.06% |
| Jamaica | $0.18 | 3.51% | 42.57% |
| Jersey | $0.14 | 3.03% | 34.31% |
| Jordan | $0.38 | 2.67% | 24.93% |
| Japan | $0.17 | 1.64% | 104.75% |
| Kazakhstan | $0.03 | 4.87% | 44.65% |
| Kenya | $0.11 | 2.32% | 37.53% |
| Kyrgyzstan | $0.01 | 11.42% | 34.91% |
| Cambodia | $0.04 | 4.81% | 30.06% |
| Kiribati | $0.10 | 2.67% | 33.60% |
| Saint Kitts and Nevis | $0.07 | 3.41% | 37.51% |
| Korea (the Republic of) | $0.31 | 4.80% | 13.02% |
| Kuwait | $0.15 | 3.49% | 26.01% |
| Lao People’s Democratic Republic (the) | $0.02 | 6.48% | 35.41% |
| Lebanon | $0.05 | 6.23% | 27.88% |
| Liberia | $0.06 | 6.75% | 16.25% |
| Libya | $0.03 | 5.33% | 27.91% |
| Saint Lucia | $0.27 | 4.27% | 45.10% |
| Liechtenstein | $0.60 | 0.62% | 32.26% |
| Sri Lanka | $0.04 | 3.55% | 46.62% |
| Lesotho | $0.06 | 3.38% | 38.56% |
| Lithuania | $0.12 | 2.92% | 35.50% |
| Luxembourg | $0.30 | 4.33% | 26.73% |
| Latvia | $0.13 | 3.55% | 29.44% |
| Macao | $0.34 | 3.03% | 25.90% |
| Saint Martin (French part) | $0.20 | 1.82% | 23.08% |
| Morocco | $0.05 | 6.18% | 32.74% |
| Monaco | $0.38 | 3.12% | 53.88% |
| Moldova (the Republic of) | $0.05 | 6.35% | 39.58% |
| Madagascar | $0.03 | 3.66% | 51.50% |
| Maldives | $0.05 | 6.00% | 37.61% |
| Mexico | $0.38 | 1.65% | 22.76% |
| Marshall Islands (the) | $0.05 | 3.44% | 31.66% |
| Republic of North Macedonia | $0.06 | 5.84% | 33.81% |
| Mali | $0.09 | 8.16% | 13.73% |
| Malta | $0.24 | 3.07% | 46.50% |
| Myanmar | $0.01 | 10.27% | 15.58% |
| Montenegro | $0.09 | 5.00% | 35.81% |
| Mongolia | $0.03 | 6.04% | 33.66% |
| Northern Mariana Islands (the) | $0.10 | 2.34% | 43.59% |
| Mozambique | $0.08 | 5.34% | 53.02% |
| Mauritania | $0.03 | 6.91% | 29.06% |
| Montserrat | $0.07 | 1.96% | 35.72% |
| Martinique | $0.14 | 2.53% | 34.98% |
| Mauritius | $0.07 | 5.35% | 40.61% |
| Malawi | $0.05 | 4.87% | 31.62% |
| Malaysia | $0.17 | 2.37% | 18.61% |
| Mayotte | $0.08 | 2.75% | 37.55% |
| Namibia | $0.38 | 3.90% | 67.80% |
| New Caledonia | $0.09 | 4.05% | 28.09% |
| Niger (the) | $0.03 | 10.33% | 19.96% |
| Norfolk Island | $0.45 | 1.32% | 19.11% |
| Nigeria | $0.10 | 1.66% | 47.77% |
| Nicaragua | $0.03 | 4.86% | 42.53% |
| Niue | $3.58 | 1.57% | 2.82% |
| Netherlands (the) | $1.11 | 2.02% | 23.56% |
| Norway | $0.54 | 2.54% | 28.69% |
| Nepal | $0.01 | 8.45% | 21.03% |
| Nauru | $0.52 | 1.32% | 18.79% |
| New Zealand | $0.81 | 1.72% | 37.26% |
| Oman | $0.07 | 5.16% | 28.87% |
| Pakistan | $0.02 | 6.65% | 23.91% |
| Panama | $0.07 | 4.13% | 49.84% |
| Pitcairn | $0.12 | 3.92% | 28.33% |
| Peru | $0.14 | 2.22% | 34.20% |
| Philippines (the) | $0.09 | 2.63% | 26.67% |
| Palau | $0.11 | 2.59% | 31.34% |
| Papua New Guinea | $0.09 | 6.87% | 17.79% |
| Poland | $0.25 | 1.95% | 39.91% |
| Puerto Rico | $0.41 | 2.65% | 45.03% |
| Korea (the Democratic People’s Republic of) | $0.00 | 1.75% | 687.50% |
| Portugal | $0.46 | 1.42% | 32.17% |
| Paraguay | $0.03 | 5.37% | 39.73% |
| Palestine, State of | $0.03 | 8.39% | 28.07% |
| French Polynesia | $0.14 | 4.25% | 33.88% |
| Qatar | $0.14 | 3.34% | 39.97% |
| Réunion | $0.10 | 2.99% | 37.73% |
| Romania | $0.15 | 2.71% | 42.00% |
| Russian Federation (the) | $0.04 | 6.54% | 45.24% |
| Rwanda | $0.08 | 6.34% | 27.75% |
| Saudi Arabia | $0.11 | 3.79% | 44.76% |
| Sudan (the) | $0.01 | 8.91% | 45.43% |
| Senegal | $0.03 | 6.04% | 38.57% |
| Singapore | $0.33 | 3.03% | 37.58% |
| Saint Helena, Ascension and Tristan da Cunha | $0.02 | 2.61% | 87.23% |
| Svalbard and Jan Mayen | $2.83 | 0.70% | 9.23% |
| Solomon Islands | $0.06 | 5.81% | 18.67% |
| Sierra Leone | $0.07 | 4.84% | 27.80% |
| El Salvador | $0.07 | 3.61% | 49.86% |
| San Marino | $0.11 | 2.77% | 37.12% |
| Somalia | $0.02 | 7.23% | 37.66% |
| Saint Pierre and Miquelon | $0.18 | 1.11% | 29.51% |
| Serbia | $0.06 | 2.88% | 31.38% |
| South Sudan | $0.06 | 3.32% | 32.23% |
| Sao Tome and Principe | $0.03 | 3.72% | 45.08% |
| Suriname | $0.05 | 6.04% | 33.88% |
| Slovakia | $0.12 | 3.07% | 32.83% |
| Slovenia | $0.24 | 4.10% | 33.37% |
| Sweden | $0.55 | 2.94% | 26.52% |
| Eswatini | $0.23 | 3.65% | 34.85% |
| Sint Maarten (Dutch part) | $0.08 | 3.84% | 31.65% |
| Seychelles | $0.01 | 4.33% | 87.74% |
| Syrian Arab Republic | $0.00 | 17.83% | 199.06% |
| Turks and Caicos Islands (the) | $0.11 | 2.62% | 36.83% |
| Chad | $0.08 | 6.44% | 19.79% |
| Togo | $0.02 | 5.32% | 43.84% |
| Thailand | $0.20 | 2.62% | 23.64% |
| Tajikistan | $0.01 | 12.34% | 33.90% |
| Tokelau | $0.03 | 5.39% | 21.34% |
| Turkmenistan | $0.00 | 5.27% | 155.64% |
| Timor-Leste | $0.04 | 4.23% | 33.97% |
| Tonga | $0.08 | 2.65% | 29.01% |
| Trinidad and Tobago | $0.04 | 6.11% | 36.06% |
| Tunisia | $0.03 | 5.19% | 35.17% |
| Turkey | $0.10 | 2.87% | 36.03% |
| Tuvalu | $0.39 | 1.28% | 22.22% |
| Taiwan (Province of China) | $0.55 | 1.18% | 33.42% |
| Tanzania, United Republic of | $0.07 | 3.01% | 42.20% |
| Uganda | $0.05 | 5.39% | 40.57% |
| Ukraine | $0.05 | 3.56% | 35.58% |
| Uruguay | $0.07 | 2.87% | 49.76% |
| United States of America (the) | $2.04 | 1.95% | 31.76% |
| Uzbekistan | $0.01 | 9.72% | 46.20% |
| Holy See (the) | $0.27 | 2.46% | 81.05% |
| Saint Vincent and the Grenadines | $0.03 | 4.45% | 35.96% |
| Venezuela (Bolivarian Republic of) | $0.02 | 4.37% | 31.76% |
| Virgin Islands (British) | $0.30 | 2.98% | 29.08% |
| Virgin Islands (U.S.) | $0.17 | 2.50% | 29.78% |
| Viet Nam | $0.04 | 4.38% | 32.02% |
| Vanuatu | $0.06 | 8.83% | 9.05% |
| Wallis and Futuna | $0.11 | 1.81% | 22.47% |
| Samoa | $0.08 | 4.45% | 26.00% |
| Yemen | $0.02 | 6.81% | 25.08% |
| South Africa | $0.25 | 2.22% | 26.69% |
| Zambia | $0.04 | 5.78% | 40.59% |
| Zimbabwe | $0.07 | 4.46% | 55.13% |
Ad networks & platforms: top gainers
Gained the most advertisers
Ad spend was basically flat in Q2 compared to Q1 of 2024: down just .51%. These ad networks gained the most ad spend:
- AppCast
- Almedia
- Roku
- Apple Search Ads
- Xbox (Microsoft Ads)
- Samsung Ads
- Kashkick
- Mintegral
- Dataseat
- RevX
- Vizio
- Taboola
- Aura from Unity
Gained the most spend as a percentage
Here are the ad networks that gained the most spend as a percentage increase from Q1 2024 to Q2 (minimum $10M spend in each quarter):
- Blisspoint: 89.72%
- AppCast: 58.64%
- Roku: 23.99%
- Adikteev: 15.18%
- Mintegral: 15.08%
- Aura from Unity: 13.01%
Note that 2 of them, including the fastest growing, are CTV networks. (Also note that Blisspoint was recently acquired by Tinuiti.)
Ad spend growth and decrease by country
Q2 was a basically flat quarter for ad spend globally. But, of course, some countries gained ad spend, and some lost.
Here are the top ad spend gainers:
- Mexico
- Brazil
- South Africa
- Indonesia
- Japan
The spend gains were not massive: virtually all were low 7 figures.
And here are the countries that lost the most ad spend. Again, the losses were not huge, with almost all being in the low 7 figures as well.
- Germany
- UK
- Canada
- France
- Australia
Interestingly, 3 of these countries were also among those that gained the most spend in the quarter, from April to June:
- India
- Canada
- Japan
- Brazil
- UK
Hottest genres with the most downloads: global
Android games
Casual games continue their rise at the cost of the Hyper casual space. Here’s hyper casual through the last 3 quarters as a percentage of all game installs on Android:
- Q4 2023: 36%
- Q1 2024: 21%
- Q2 2024: 24%
Meanwhile Casual games, often called hybrid casual games, are up from 21% in Q1 to 25% of all gaming downloads measured by Singular, taking the role of the leading category by installs for the first time. In other words, Hyper casual games are upscaling.
Android non-gaming
Entertainment stays at the top of the leaderboard for Q1 again. Lifestyle apps take second place, followed by Social.
iOS games
We’re seeing the same shift in iOS as we did on Android: growth of the Casual gaming genre at the expense of the hyper casual category.
But in Q2 that accelerated even more on iOS, with the hybrid casual space taking over even more and growing from 13% to over 18% of all installs.
iOS: non-gaming
Music & Audio regained the lead from Entertainment in Q2. Travel rebounded in Q2, gaining from 5.63% of installs to 9.17%.
Key metrics by vertical
Click-through rates: games
In general for Q2 2024, CTRs increased for games and decreased for apps.
On Android, we see CTRs in Racing games lead, followed by Educational games at 7.75% and Hyper casual games at 6.7%.
On iOS, CTR for Puzzle games was the highest at just over 9%, followed by Hyper casual at 6.54%.
Click-through rates: apps
CTRs for apps were slightly down both on Android and iOS overall in Q2.
On Android, Photo & Video continued to get the highest CTR, and it increased from last quarter’s 4.84 to Q2’s 6.51%. Other high-performing verticals include Shopping, Social (at almost 5%), and Business.
On iOS, the CTR decrease was less than Android’s.
But high-performing verticals were hard to come by. Entertainment came in at almost 5%, and Art & Design as well as Photo & Video were amazingly high at around 10.3%. Other than that, most categories see around a 1% click-through rate.
IPM: games
In general, IPM was slightly up for Android apps and games, as well as iOS apps.
For Android games, Racing and Educational took the lead.
Educational and Trivia games led on iOS for installs per thousand ad views.
IPM: apps
IPM is slightly up in Q2 2024, especially in Android games and iOS apps. Only iOS games were down for IPM quarter over quarter.
For Android apps, Health & Fitness jumped 2 spaces and added almost 5 installs per thousand ad views from Q1, while Art & Design added almost 7 installs per mille.
Travel and Maps & Navigation lead the way for IPM rates for iOS apps.
Platform share: iOS, Android, web
For Q2 2024, ad spend split was 38.74% iOS, 37.91% Android, and 23.36% web.
That’s a drop on iOS from almost 40% last quarter and an increase on Android from 36.4%%.
Web basically held steady.
Platform spend by country
| Country | Platform | % of Total Cost |
|---|---|---|
| Aruba | iOS | 37.46% |
| Android | 61.32% | |
| Desktop & Web | 1.21% | |
| Afghanistan | iOS | 35.43% |
| Android | 61.74% | |
| Desktop & Web | 2.84% | |
| Angola | iOS | 36.25% |
| Android | 56.07% | |
| Desktop & Web | 7.68% | |
| Anguilla | iOS | 33.52% |
| Android | 63.57% | |
| Desktop & Web | 2.92% | |
| Åland Islands | iOS | 71.20% |
| Android | 28.80% | |
| Desktop & Web | ||
| Albania | iOS | 56.09% |
| Android | 38.48% | |
| Desktop & Web | 5.42% | |
| Andorra | iOS | 69.51% |
| Android | 23.35% | |
| Desktop & Web | 7.14% | |
| United Arab Emirates (the) | iOS | 43.21% |
| Android | 36.26% | |
| Desktop & Web | 20.53% | |
| Argentina | iOS | 13.27% |
| Android | 67.41% | |
| Desktop & Web | 19.32% | |
| Armenia | iOS | 42.83% |
| Android | 50.00% | |
| Desktop & Web | 7.17% | |
| American Samoa | iOS | 57.92% |
| Android | 35.70% | |
| Desktop & Web | 6.38% | |
| Antarctica | iOS | 21.04% |
| Android | 73.06% | |
| Desktop & Web | 5.90% | |
| French Southern Territories (the) | iOS | 28.82% |
| Android | 70.66% | |
| Desktop & Web | 0.52% | |
| Antigua and Barbuda | iOS | 24.66% |
| Android | 73.75% | |
| Desktop & Web | 1.59% | |
| Australia | iOS | 39.71% |
| Android | 33.15% | |
| Desktop & Web | 27.15% | |
| Austria | iOS | 25.17% |
| Android | 55.62% | |
| Desktop & Web | 19.21% | |
| Azerbaijan | iOS | 26.17% |
| Android | 69.65% | |
| Desktop & Web | 4.18% | |
| Burundi | iOS | 22.27% |
| Android | 70.74% | |
| Desktop & Web | 6.99% | |
| Belgium | iOS | 31.12% |
| Android | 48.78% | |
| Desktop & Web | 20.09% | |
| Benin | iOS | 21.57% |
| Android | 45.30% | |
| Desktop & Web | 33.12% | |
| Bonaire, Sint Eustatius and Saba | iOS | 47.91% |
| Android | 50.16% | |
| Desktop & Web | 1.93% | |
| Burkina Faso | iOS | 3.12% |
| Android | 13.14% | |
| Desktop & Web | 83.74% | |
| Bangladesh | iOS | 13.84% |
| Android | 77.30% | |
| Desktop & Web | 8.86% | |
| Bulgaria | iOS | 21.35% |
| Android | 59.95% | |
| Desktop & Web | 18.70% | |
| Bahrain | iOS | 57.13% |
| Android | 37.75% | |
| Desktop & Web | 5.12% | |
| Bahamas (the) | iOS | 35.68% |
| Android | 62.64% | |
| Desktop & Web | 1.68% | |
| Bosnia and Herzegovina | iOS | 26.29% |
| Android | 69.32% | |
| Desktop & Web | 4.39% | |
| Saint Barthélemy | iOS | 41.02% |
| Android | 51.52% | |
| Desktop & Web | 7.46% | |
| Belarus | iOS | 18.23% |
| Android | 80.30% | |
| Desktop & Web | 1.47% | |
| Belize | iOS | 14.35% |
| Android | 84.22% | |
| Desktop & Web | 1.44% | |
| Bermuda | iOS | 61.74% |
| Android | 35.75% | |
| Desktop & Web | 2.51% | |
| Bolivia (Plurinational State of) | iOS | 14.37% |
| Android | 79.12% | |
| Desktop & Web | 6.51% | |
| Brazil | iOS | 18.87% |
| Android | 61.87% | |
| Desktop & Web | 19.26% | |
| Barbados | iOS | 28.43% |
| Android | 69.67% | |
| Desktop & Web | 1.90% | |
| Brunei Darussalam | iOS | 52.79% |
| Android | 43.28% | |
| Desktop & Web | 3.92% | |
| Bhutan | iOS | 46.08% |
| Android | 49.85% | |
| Desktop & Web | 4.07% | |
| Bouvet Island | Android | |
| Botswana | iOS | 35.69% |
| Android | 57.81% | |
| Desktop & Web | 6.50% | |
| Central African Republic (the) | iOS | 24.75% |
| Android | 68.27% | |
| Desktop & Web | 6.98% | |
| Canada | iOS | 40.93% |
| Android | 35.89% | |
| Desktop & Web | 23.19% | |
| Cocos (Keeling) Islands (the) | iOS | 35.89% |
| Android | 63.54% | |
| Desktop & Web | 0.57% | |
| Switzerland | iOS | 40.83% |
| Android | 42.01% | |
| Desktop & Web | 17.16% | |
| Chile | iOS | 17.21% |
| Android | 57.89% | |
| Desktop & Web | 24.89% | |
| China | iOS | 83.20% |
| Android | 4.94% | |
| Desktop & Web | 11.87% | |
| Côte d’Ivoire | iOS | 44.13% |
| Android | 43.86% | |
| Desktop & Web | 12.02% | |
| Cameroon | iOS | 22.89% |
| Android | 66.28% | |
| Desktop & Web | 10.83% | |
| Congo (the Democratic Republic of the) | iOS | 36.47% |
| Android | 58.40% | |
| Desktop & Web | 5.13% | |
| Congo (the) | iOS | 45.36% |
| Android | 48.30% | |
| Desktop & Web | 6.34% | |
| Cook Islands (the) | iOS | 43.79% |
| Android | 46.27% | |
| Desktop & Web | 9.94% | |
| Colombia | iOS | 20.51% |
| Android | 61.79% | |
| Desktop & Web | 17.69% | |
| Comoros (the) | iOS | 24.42% |
| Android | 70.62% | |
| Desktop & Web | 4.96% | |
| Cabo Verde | iOS | 48.68% |
| Android | 48.40% | |
| Desktop & Web | 2.92% | |
| Costa Rica | iOS | 18.13% |
| Android | 75.84% | |
| Desktop & Web | 6.03% | |
| Cuba | iOS | 24.86% |
| Android | 75.05% | |
| Desktop & Web | 0.09% | |
| Curaçao | iOS | 31.39% |
| Android | 67.17% | |
| Desktop & Web | 1.43% | |
| Christmas Island | iOS | 30.19% |
| Android | 65.92% | |
| Desktop & Web | 3.88% | |
| Cayman Islands (the) | iOS | 49.57% |
| Android | 46.59% | |
| Desktop & Web | 3.84% | |
| Cyprus | iOS | 32.17% |
| Android | 52.80% | |
| Desktop & Web | 15.03% | |
| Czechia | iOS | 19.65% |
| Android | 63.61% | |
| Desktop & Web | 16.74% | |
| Germany | iOS | 30.49% |
| Android | 47.99% | |
| Desktop & Web | 21.53% | |
| Djibouti | iOS | 26.80% |
| Android | 64.01% | |
| Desktop & Web | 9.20% | |
| Dominica | iOS | 17.95% |
| Android | 80.40% | |
| Desktop & Web | 1.65% | |
| Denmark | iOS | 36.82% |
| Android | 26.15% | |
| Desktop & Web | 37.02% | |
| Dominican Republic (the) | iOS | 18.54% |
| Android | 79.11% | |
| Desktop & Web | 2.35% | |
| Algeria | iOS | 15.45% |
| Android | 80.43% | |
| Desktop & Web | 4.12% | |
| Ecuador | iOS | 20.64% |
| Android | 71.31% | |
| Desktop & Web | 8.05% | |
| Egypt | iOS | 30.13% |
| Android | 62.72% | |
| Desktop & Web | 7.14% | |
| Eritrea | iOS | 8.85% |
| Android | 54.00% | |
| Desktop & Web | 37.15% | |
| Western Sahara | iOS | 13.79% |
| Android | 64.96% | |
| Desktop & Web | 21.25% | |
| Spain | iOS | 25.54% |
| Android | 38.62% | |
| Desktop & Web | 35.84% | |
| Estonia | iOS | 21.79% |
| Android | 64.05% | |
| Desktop & Web | 14.16% | |
| Ethiopia | iOS | 14.03% |
| Android | 73.38% | |
| Desktop & Web | 12.59% | |
| Finland | iOS | 21.20% |
| Android | 42.94% | |
| Desktop & Web | 35.86% | |
| Fiji | iOS | 22.46% |
| Android | 64.01% | |
| Desktop & Web | 13.53% | |
| Falkland Islands (the) [Malvinas] | iOS | 39.98% |
| Android | 58.01% | |
| Desktop & Web | 2.01% | |
| France | iOS | 34.82% |
| Android | 39.70% | |
| Desktop & Web | 25.48% | |
| Faroe Islands (the) | iOS | 65.25% |
| Android | 31.89% | |
| Desktop & Web | 2.86% | |
| Micronesia (Federated States of) | iOS | 47.31% |
| Android | 51.51% | |
| Desktop & Web | 1.18% | |
| Gabon | iOS | 28.12% |
| Android | 66.61% | |
| Desktop & Web | 5.27% | |
| United Kingdom of Great Britain and Northern Ireland (the) | iOS | 41.60% |
| Android | 34.96% | |
| Desktop & Web | 23.43% | |
| Georgia | iOS | 42.60% |
| Android | 51.31% | |
| Desktop & Web | 6.09% | |
| Guernsey | iOS | 70.55% |
| Android | 26.35% | |
| Desktop & Web | 3.10% | |
| Ghana | iOS | 25.43% |
| Android | 34.32% | |
| Desktop & Web | 40.25% | |
| Gibraltar | iOS | 71.46% |
| Android | 24.55% | |
| Desktop & Web | 3.99% | |
| Guinea | iOS | 43.92% |
| Android | 48.72% | |
| Desktop & Web | 7.35% | |
| Guadeloupe | iOS | 32.34% |
| Android | 59.13% | |
| Desktop & Web | 8.53% | |
| Gambia (the) | iOS | 46.09% |
| Android | 45.25% | |
| Desktop & Web | 8.66% | |
| Guinea-Bissau | iOS | 25.03% |
| Android | 71.44% | |
| Desktop & Web | 3.53% | |
| Equatorial Guinea | iOS | 50.70% |
| Android | 46.29% | |
| Desktop & Web | 3.01% | |
| Greece | iOS | 20.81% |
| Android | 50.13% | |
| Desktop & Web | 29.06% | |
| Grenada | iOS | 22.79% |
| Android | 75.72% | |
| Desktop & Web | 1.48% | |
| Greenland | iOS | 52.03% |
| Android | 44.16% | |
| Desktop & Web | 3.81% | |
| Guatemala | iOS | 6.79% |
| Android | 88.26% | |
| Desktop & Web | 4.94% | |
| French Guiana | iOS | 39.97% |
| Android | 49.83% | |
| Desktop & Web | 10.20% | |
| Guam | iOS | 51.05% |
| Android | 47.17% | |
| Desktop & Web | 1.78% | |
| Guyana | iOS | 35.06% |
| Android | 59.99% | |
| Desktop & Web | 4.95% | |
| Hong Kong | iOS | 52.53% |
| Android | 36.65% | |
| Desktop & Web | 10.82% | |
| Heard Island and McDonald Islands | Android | 100.00% |
| Honduras | iOS | 11.61% |
| Android | 86.87% | |
| Desktop & Web | 1.52% | |
| Croatia | iOS | 22.25% |
| Android | 69.87% | |
| Desktop & Web | 7.88% | |
| Haiti | iOS | 2.42% |
| Android | 96.82% | |
| Desktop & Web | 0.76% | |
| Hungary | iOS | 20.20% |
| Android | 56.14% | |
| Desktop & Web | 23.65% | |
| Indonesia | iOS | 13.58% |
| Android | 81.68% | |
| Desktop & Web | 4.74% | |
| Isle of Man | iOS | 66.68% |
| Android | 31.10% | |
| Desktop & Web | 2.21% | |
| India | iOS | 12.51% |
| Android | 70.02% | |
| Desktop & Web | 17.47% | |
| British Indian Ocean Territory (the) | iOS | 23.36% |
| Android | 74.82% | |
| Desktop & Web | 1.82% | |
| Ireland | iOS | 24.26% |
| Android | 39.04% | |
| Desktop & Web | 36.70% | |
| Iran (Islamic Republic of) | iOS | 37.94% |
| Android | 59.53% | |
| Desktop & Web | 2.53% | |
| Iraq | iOS | 46.18% |
| Android | 49.78% | |
| Desktop & Web | 4.03% | |
| Iceland | iOS | 39.65% |
| Android | 50.61% | |
| Desktop & Web | 9.74% | |
| Israel | iOS | 40.99% |
| Android | 45.40% | |
| Desktop & Web | 13.60% | |
| Italy | iOS | 30.39% |
| Android | 44.32% | |
| Desktop & Web | 25.29% | |
| Jamaica | iOS | 13.38% |
| Android | 84.38% | |
| Desktop & Web | 2.24% | |
| Jersey | iOS | 54.97% |
| Android | 22.89% | |
| Desktop & Web | 22.14% | |
| Jordan | iOS | 18.46% |
| Android | 15.52% | |
| Desktop & Web | 66.02% | |
| Japan | iOS | 47.48% |
| Android | 42.30% | |
| Desktop & Web | 10.22% | |
| Kazakhstan | iOS | 28.58% |
| Android | 69.90% | |
| Desktop & Web | 1.52% | |
| Kenya | iOS | 7.07% |
| Android | 83.81% | |
| Desktop & Web | 9.12% | |
| Kyrgyzstan | iOS | 21.82% |
| Android | 77.13% | |
| Desktop & Web | 1.05% | |
| Cambodia | iOS | 62.47% |
| Android | 35.29% | |
| Desktop & Web | 2.24% | |
| Kiribati | iOS | 19.39% |
| Android | 62.07% | |
| Desktop & Web | 18.54% | |
| Saint Kitts and Nevis | iOS | 32.69% |
| Android | 66.05% | |
| Desktop & Web | 1.27% | |
| Korea (the Republic of) | iOS | 21.06% |
| Android | 74.86% | |
| Desktop & Web | 4.09% | |
| Kuwait | iOS | 66.47% |
| Android | 30.90% | |
| Desktop & Web | 2.64% | |
| Lao People’s Democratic Republic (the) | iOS | 54.24% |
| Android | 43.79% | |
| Desktop & Web | 1.97% | |
| Lebanon | iOS | 50.90% |
| Android | 42.95% | |
| Desktop & Web | 6.15% | |
| Liberia | iOS | 50.17% |
| Android | 43.40% | |
| Desktop & Web | 6.43% | |
| Libya | iOS | 50.07% |
| Android | 48.00% | |
| Desktop & Web | 1.93% | |
| Saint Lucia | iOS | 16.52% |
| Android | 82.13% | |
| Desktop & Web | 1.35% | |
| Liechtenstein | iOS | 52.08% |
| Android | 30.81% | |
| Desktop & Web | 17.11% | |
| Sri Lanka | iOS | 27.70% |
| Android | 60.91% | |
| Desktop & Web | 11.39% | |
| Lesotho | iOS | 27.52% |
| Android | 51.86% | |
| Desktop & Web | 20.61% | |
| Lithuania | iOS | 20.29% |
| Android | 70.17% | |
| Desktop & Web | 9.54% | |
| Luxembourg | iOS | 44.25% |
| Android | 39.16% | |
| Desktop & Web | 16.59% | |
| Latvia | iOS | 22.48% |
| Android | 64.48% | |
| Desktop & Web | 13.04% | |
| Macao | iOS | 68.50% |
| Android | 24.71% | |
| Desktop & Web | 6.79% | |
| Saint Martin (French part) | iOS | 40.34% |
| Android | 59.18% | |
| Desktop & Web | 0.48% | |
| Morocco | iOS | 22.01% |
| Android | 50.73% | |
| Desktop & Web | 27.26% | |
| Monaco | iOS | 69.41% |
| Android | 24.97% | |
| Desktop & Web | 5.62% | |
| Moldova (the Republic of) | iOS | 25.05% |
| Android | 69.90% | |
| Desktop & Web | 5.05% | |
| Madagascar | iOS | 25.45% |
| Android | 61.70% | |
| Desktop & Web | 12.85% | |
| Maldives | iOS | 46.76% |
| Android | 46.45% | |
| Desktop & Web | 6.78% | |
| Mexico | iOS | 18.73% |
| Android | 57.09% | |
| Desktop & Web | 24.18% | |
| Marshall Islands (the) | iOS | 46.81% |
| Android | 52.25% | |
| Desktop & Web | 0.94% | |
| Republic of North Macedonia | iOS | 42.70% |
| Android | 51.38% | |
| Desktop & Web | 5.92% | |
| Mali | iOS | 16.67% |
| Android | 23.75% | |
| Desktop & Web | 59.59% | |
| Malta | iOS | 45.18% |
| Android | 44.41% | |
| Desktop & Web | 10.40% | |
| Myanmar | iOS | 33.13% |
| Android | 59.04% | |
| Desktop & Web | 7.83% | |
| Montenegro | iOS | 61.11% |
| Android | 33.15% | |
| Desktop & Web | 5.74% | |
| Mongolia | iOS | 59.24% |
| Android | 33.68% | |
| Desktop & Web | 7.08% | |
| Northern Mariana Islands (the) | iOS | 55.84% |
| Android | 38.01% | |
| Desktop & Web | 6.14% | |
| Mozambique | iOS | 24.00% |
| Android | 66.56% | |
| Desktop & Web | 9.44% | |
| Mauritania | iOS | 45.98% |
| Android | 49.73% | |
| Desktop & Web | 4.29% | |
| Montserrat | iOS | 32.81% |
| Android | 65.01% | |
| Desktop & Web | 2.19% | |
| Martinique | iOS | 28.69% |
| Android | 64.59% | |
| Desktop & Web | 6.71% | |
| Mauritius | iOS | 28.76% |
| Android | 63.04% | |
| Desktop & Web | 8.20% | |
| Malawi | iOS | 20.45% |
| Android | 70.69% | |
| Desktop & Web | 8.86% | |
| Malaysia | iOS | 36.16% |
| Android | 60.52% | |
| Desktop & Web | 3.32% | |
| Mayotte | iOS | 32.94% |
| Android | 58.02% | |
| Desktop & Web | 9.04% | |
| Namibia | iOS | 33.06% |
| Android | 62.47% | |
| Desktop & Web | 4.48% | |
| New Caledonia | iOS | 57.08% |
| Android | 40.39% | |
| Desktop & Web | 2.53% | |
| Niger (the) | iOS | 22.81% |
| Android | 69.93% | |
| Desktop & Web | 7.26% | |
| Norfolk Island | iOS | 43.08% |
| Android | 49.03% | |
| Desktop & Web | 7.89% | |
| Nigeria | iOS | 16.83% |
| Android | 76.23% | |
| Desktop & Web | 6.94% | |
| Nicaragua | iOS | 3.22% |
| Android | 95.67% | |
| Desktop & Web | 1.11% | |
| Niue | iOS | 41.08% |
| Android | 51.07% | |
| Desktop & Web | 7.85% | |
| Netherlands (the) | iOS | 24.10% |
| Android | 38.03% | |
| Desktop & Web | 37.87% | |
| Norway | iOS | 37.63% |
| Android | 42.44% | |
| Desktop & Web | 19.93% | |
| Nepal | iOS | 37.81% |
| Android | 53.24% | |
| Desktop & Web | 8.95% | |
| Nauru | iOS | 26.05% |
| Android | 67.23% | |
| Desktop & Web | 6.73% | |
| New Zealand | iOS | 27.64% |
| Android | 49.24% | |
| Desktop & Web | 23.13% | |
| Oman | iOS | 49.50% |
| Android | 45.85% | |
| Desktop & Web | 4.65% | |
| Pakistan | iOS | 16.21% |
| Android | 70.63% | |
| Desktop & Web | 13.16% | |
| Panama | iOS | 12.53% |
| Android | 83.51% | |
| Desktop & Web | 3.96% | |
| Pitcairn | iOS | 54.17% |
| Android | 45.52% | |
| Desktop & Web | 0.31% | |
| Peru | iOS | 18.37% |
| Android | 66.67% | |
| Desktop & Web | 14.96% | |
| Philippines (the) | iOS | 23.56% |
| Android | 71.12% | |
| Desktop & Web | 5.32% | |
| Palau | iOS | 52.20% |
| Android | 47.01% | |
| Desktop & Web | 0.79% | |
| Papua New Guinea | iOS | 8.13% |
| Android | 57.55% | |
| Desktop & Web | 34.32% | |
| Poland | iOS | 13.63% |
| Android | 49.10% | |
| Desktop & Web | 37.28% | |
| Puerto Rico | iOS | 49.05% |
| Android | 40.61% | |
| Desktop & Web | 10.33% | |
| Korea (the Democratic People’s Republic of) | iOS | 32.50% |
| Android | 67.50% | |
| Portugal | iOS | 28.29% |
| Android | 41.58% | |
| Desktop & Web | 30.13% | |
| Paraguay | iOS | 26.99% |
| Android | 67.92% | |
| Desktop & Web | 5.09% | |
| Palestine, State of | iOS | 53.59% |
| Android | 37.75% | |
| Desktop & Web | 8.66% | |
| French Polynesia | iOS | 50.08% |
| Android | 43.94% | |
| Desktop & Web | 5.98% | |
| Qatar | iOS | 57.67% |
| Android | 34.72% | |
| Desktop & Web | 7.61% | |
| Réunion | iOS | 41.57% |
| Android | 44.92% | |
| Desktop & Web | 13.50% | |
| Romania | iOS | 23.16% |
| Android | 63.57% | |
| Desktop & Web | 13.27% | |
| Russian Federation (the) | iOS | 28.74% |
| Android | 68.40% | |
| Desktop & Web | 2.86% | |
| Rwanda | iOS | 16.53% |
| Android | 75.20% | |
| Desktop & Web | 8.27% | |
| Saudi Arabia | iOS | 58.53% |
| Android | 35.60% | |
| Desktop & Web | 5.86% | |
| Sudan (the) | iOS | 5.71% |
| Android | 88.30% | |
| Desktop & Web | 5.99% | |
| Senegal | iOS | 57.09% |
| Android | 34.95% | |
| Desktop & Web | 7.96% | |
| Singapore | iOS | 40.26% |
| Android | 48.60% | |
| Desktop & Web | 11.15% | |
| South Georgia and the South Sandwich Islands | iOS | 38.49% |
| Android | 52.72% | |
| Desktop & Web | 8.79% | |
| Saint Helena, Ascension and Tristan da Cunha | iOS | 22.87% |
| Android | 75.46% | |
| Desktop & Web | 1.67% | |
| Svalbard and Jan Mayen | iOS | 51.47% |
| Android | 39.44% | |
| Desktop & Web | 9.09% | |
| Solomon Islands | iOS | 24.49% |
| Android | 56.23% | |
| Desktop & Web | 19.28% | |
| Sierra Leone | iOS | 44.50% |
| Android | 49.95% | |
| Desktop & Web | 5.55% | |
| El Salvador | iOS | 10.04% |
| Android | 85.34% | |
| Desktop & Web | 4.62% | |
| San Marino | iOS | 56.31% |
| Android | 36.91% | |
| Desktop & Web | 6.78% | |
| Somalia | iOS | 26.01% |
| Android | 64.75% | |
| Desktop & Web | 9.24% | |
| Saint Pierre and Miquelon | iOS | 66.36% |
| Android | 31.28% | |
| Desktop & Web | 2.36% | |
| Serbia | iOS | 22.58% |
| Android | 73.24% | |
| Desktop & Web | 4.18% | |
| South Sudan | iOS | 33.84% |
| Android | 56.15% | |
| Desktop & Web | 10.01% | |
| Sao Tome and Principe | iOS | 29.83% |
| Android | 67.38% | |
| Desktop & Web | 2.80% | |
| Suriname | iOS | 39.40% |
| Android | 55.51% | |
| Desktop & Web | 5.09% | |
| Slovakia | iOS | 19.76% |
| Android | 71.09% | |
| Desktop & Web | 9.15% | |
| Slovenia | iOS | 20.62% |
| Android | 54.91% | |
| Desktop & Web | 24.48% | |
| Sweden | iOS | 43.86% |
| Android | 35.29% | |
| Desktop & Web | 20.85% | |
| Eswatini | iOS | 32.23% |
| Android | 52.77% | |
| Desktop & Web | 15.01% | |
| Sint Maarten (Dutch part) | iOS | 42.75% |
| Android | 55.66% | |
| Desktop & Web | 1.59% | |
| Seychelles | iOS | 48.35% |
| Android | 47.63% | |
| Desktop & Web | 4.03% | |
| Syrian Arab Republic | iOS | 9.70% |
| Android | 90.29% | |
| Desktop & Web | 0.01% | |
| Turks and Caicos Islands (the) | iOS | 49.95% |
| Android | 47.73% | |
| Desktop & Web | 2.31% | |
| Chad | iOS | 22.96% |
| Android | 73.82% | |
| Desktop & Web | 3.23% | |
| Togo | iOS | 24.79% |
| Android | 61.27% | |
| Desktop & Web | 13.94% | |
| Thailand | iOS | 42.40% |
| Android | 51.47% | |
| Desktop & Web | 6.13% | |
| Tajikistan | iOS | 17.11% |
| Android | 81.78% | |
| Desktop & Web | 1.10% | |
| Tokelau | iOS | 48.42% |
| Android | 48.20% | |
| Desktop & Web | 3.39% | |
| Turkmenistan | iOS | 16.67% |
| Android | 80.66% | |
| Desktop & Web | 2.68% | |
| Timor-Leste | iOS | 30.42% |
| Android | 60.92% | |
| Desktop & Web | 8.66% | |
| Tonga | iOS | 55.61% |
| Android | 36.89% | |
| Desktop & Web | 7.50% | |
| Trinidad and Tobago | iOS | 16.82% |
| Android | 82.17% | |
| Desktop & Web | 1.01% | |
| Tunisia | iOS | 24.05% |
| Android | 56.16% | |
| Desktop & Web | 19.79% | |
| Turkey | iOS | 31.40% |
| Android | 60.59% | |
| Desktop & Web | 8.00% | |
| Tuvalu | iOS | 32.73% |
| Android | 55.54% | |
| Desktop & Web | 11.72% | |
| Taiwan (Province of China) | iOS | 46.35% |
| Android | 30.05% | |
| Desktop & Web | 23.60% | |
| Tanzania, United Republic of | iOS | 28.33% |
| Android | 67.58% | |
| Desktop & Web | 4.09% | |
| Uganda | iOS | 21.23% |
| Android | 70.45% | |
| Desktop & Web | 8.32% | |
| Ukraine | iOS | 18.33% |
| Android | 79.33% | |
| Desktop & Web | 2.34% | |
| United States Minor Outlying Islands (the) | iOS | 3.97% |
| Android | 96.03% | |
| Uruguay | iOS | 23.83% |
| Android | 68.62% | |
| Desktop & Web | 7.55% | |
| United States of America (the) | iOS | 42.63% |
| Android | 32.26% | |
| Desktop & Web | 25.11% | |
| Uzbekistan | iOS | 19.36% |
| Android | 78.46% | |
| Desktop & Web | 2.17% | |
| Holy See (the) | iOS | 4.78% |
| Android | 76.42% | |
| Desktop & Web | 18.80% | |
| Saint Vincent and the Grenadines | iOS | 18.86% |
| Android | 80.16% | |
| Desktop & Web | 0.98% | |
| Venezuela (Bolivarian Republic of) | iOS | 9.86% |
| Android | 87.10% | |
| Desktop & Web | 3.03% | |
| Virgin Islands (British) | iOS | 43.67% |
| Android | 53.18% | |
| Desktop & Web | 3.14% | |
| Virgin Islands (U.S.) | iOS | 55.32% |
| Android | 43.70% | |
| Desktop & Web | 0.97% | |
| Viet Nam | iOS | 40.59% |
| Android | 53.58% | |
| Desktop & Web | 5.83% | |
| Vanuatu | iOS | 32.74% |
| Android | 51.23% | |
| Desktop & Web | 16.03% | |
| Wallis and Futuna | iOS | 39.36% |
| Android | 59.46% | |
| Desktop & Web | 1.18% | |
| Samoa | iOS | 50.26% |
| Android | 48.11% | |
| Desktop & Web | 1.64% | |
| Yemen | iOS | 15.35% |
| Android | 82.46% | |
| Desktop & Web | 2.19% | |
| South Africa | iOS | 18.16% |
| Android | 63.37% | |
| Desktop & Web | 18.46% | |
| Zambia | iOS | 26.08% |
| Android | 66.17% | |
| Desktop & Web | 7.75% | |
| Zimbabwe | iOS | 36.67% |
| Android | 54.03% | |
| Desktop & Web | 9.30% |
Paid vs organic installs
All platforms global
Organic installs gained almost 2% of share in Q2 compared to Q1 2024, with organic at almost 53% and paid at just over 47%.
Android global
On Android we see more organic installs than on iOS, with 58.3% of all installs measured by Singular being organic in Q2. That’s up from 55.3% last quarter.
iOS global
On iOS, competition is tough thanks to high monetization.
So 56.5% of installs on iOS are paid, while just 43.5% are organic. (Again: of installs Singular measures.) This is essentially flat from Q1 data.
Partner contributions: SensorTower, Alison.ai, Splitmetrics, Persona.ly, Mobvista
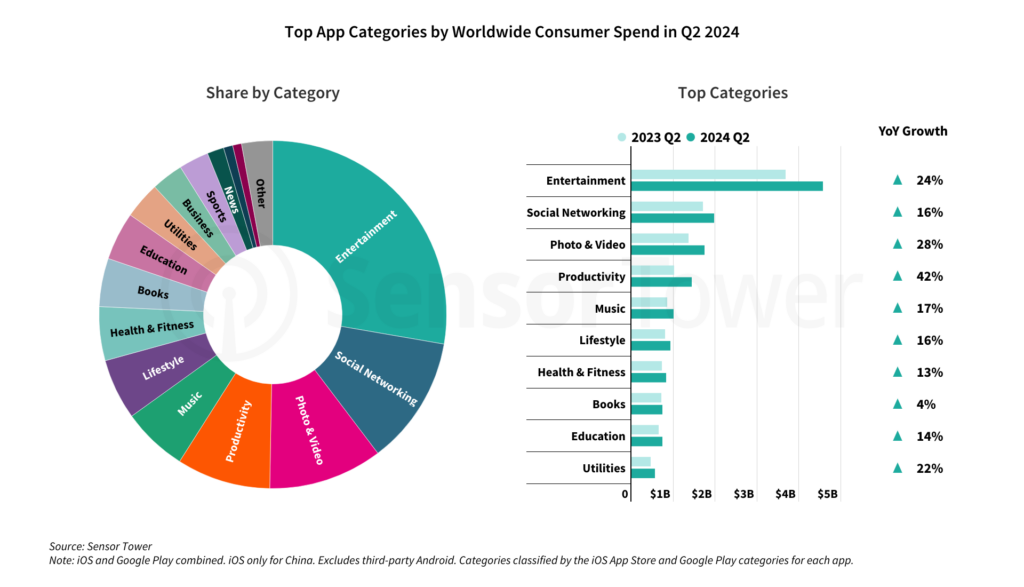
SensorTower: top categories by global consumer spend
While user acquisition on mobile has become more challenging as the app market matures, there remain plenty of opportunities for monetization. Global consumer spend on in-app purchases and subscriptions reached a record $36.2 billion in Q2 2024 across iOS and Google Play, according to our latest Digital Market Index report. This was an increase of nearly 12% year-over-year and up 77% compared to five years ago.
Non-games continued to drive the majority of this growth in Q2 2024, and all top non-game genres had positive growth. Productivity, Photo & Video, Entertainment, and Utilities each saw consumer spend grow by at least 20% year-over-year. Consumer spend in Productivity apps climbed 42%, with Google One leading the way (with nearly 40% of the category’s total).
AI is also already making an impact on mobile. ChatGPT continued to provide strong growth in the Productivity category with more than $85 million in consumer spend in Q2 2024, up 57% quarter-over-quarter. And it isn’t just AI chatbot apps – top apps in the Social, Finance, Education, and Travel categories, to name a few, have implemented new AI features to boost engagement and monetization.
Apps: top categories
Entertainment, Social Networking, and Photo & Video lead in monetization for Q2 2024, followed by Productivity, Music, and Lifestyle.
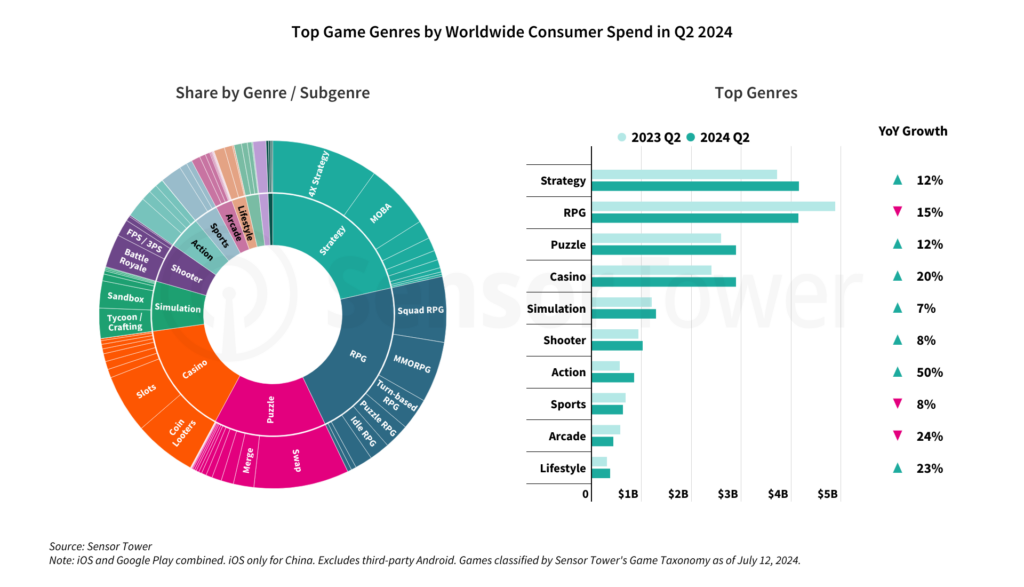
Games: top categories
In games, Strategy surged to the forefront in Q2, followed by RPG, Puzzle, and Casino. Sports and Arcade both tumbled in the quarter compared to Q1 spend.
Alison.ai: 2024 creative trends
The landscape of video advertising is rapidly evolving, driven by platform innovations, changing consumer behaviors, and the relentless pursuit of engagement.
This Alison.AI report, which analyzes 1,000 creatives with over a billion impressions, examines the latest trends shaping video advertising on YouTube, Facebook, and TikTok, uncovering how these platforms are redefining the way brands connect with audiences.
From interactive experiences on YouTube to short-form dominance on Facebook and TikTok’s emphasis on entertainment, we explore how advertisers can navigate these dynamic spaces to create impactful campaigns. Additionally, we examine how video ad strategies differ across iOS and Android devices and analyze trends specific to various app verticals, providing actionable insights for optimizing video ad performance.
Video ad trends on YouTube, Facebook, and TikTok:
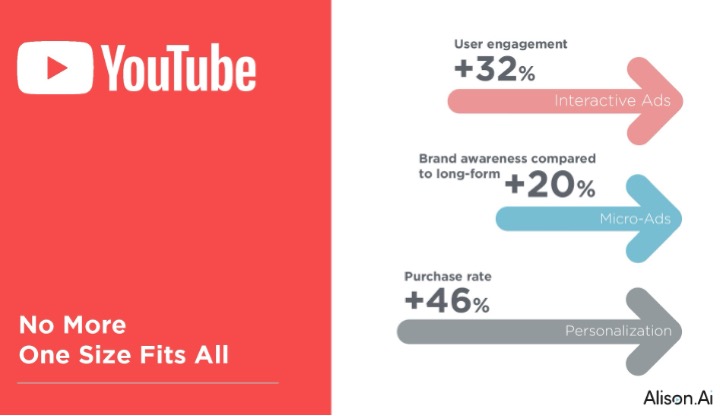
YouTube: no more one size fits all
- Interactive Ads: Interactive ads have become increasingly popular on YouTube. They allow viewers to engage with the ad by clicking on different elements, such as product features or calls-to-action. This trend not only increases engagement by 32% but also provides valuable data for advertisers.
- Micro-Ads: With the rise of short-form content, micro-ads have become a popular trend on YouTube. These ads are typically 6–10 seconds in length, aim to convey the message quickly and effectively, and on average improve brand awareness by 20% compared to long-form videos.
- Personalization: Personalization has become an important trend in video advertising on YouTube. Brands that are creating ads that use different influencers, messages, CTA’s, and scenery based on specific audience preferences, interests, and behaviors achieve a 46% lift in purchase rate on average. No More One Size Fits All.
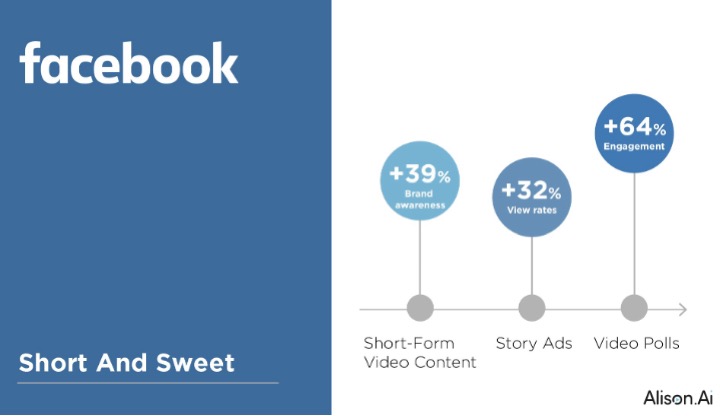
Facebook: short and sweet
- Short-Form Video Content: Brands that are using short-form video content on Facebook, often less than 15 seconds long, to capture the attention of users scrolling through their feeds achieve 39% lift in brand awareness.
- Reels: Facebook’s Reels feature has become a popular trend for video ads following the popularity of TikTok. These ads are full-screen and are viewed vertically, allowing for a more immersive and engaging experience for the viewer, and are getting 32% higher view rates.
- Video Polls: Video polls have become a popular trend on Facebook. These ads allow viewers to engage with the ad by answering a poll question related to the product or service being advertised, generating a 64% higher engagement rate.
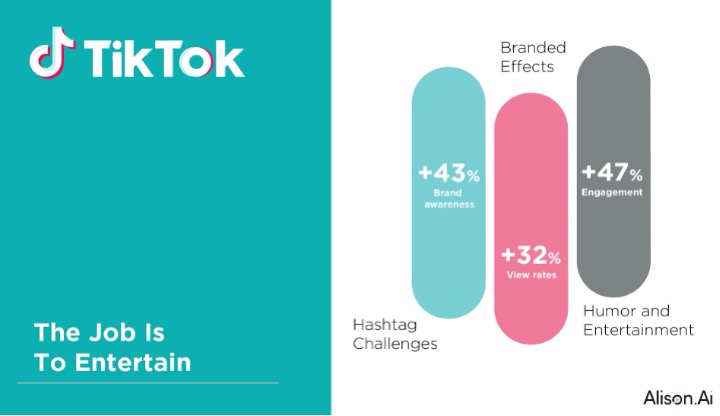
TikTok: the job is to entertain
- Hashtag Challenges: Hashtag challenges have become a popular trend on TikTok. These ads encourage viewers to create their own content related to the brand or product being advertised, increasing engagement and brand awareness by 43%.
- Branded Effects: Branded effects have become a popular trend on TikTok. These ads use augmented reality (AR) and other visual effects to create an immersive experience for the viewer. Using this type of creative effects improves brand awareness and favorability by 51%
- Humor and entertainment: TikTok is known for its humorous and entertaining content, and advertisers are leveraging this trend by creating video ads that entertain and engage the viewer. Humorous creatives help lift engagement by 47%
iOS vs. Android: think different
- Video Length: iOS users are more likely to engage with longer video ads, while Android users are more likely to engage with shorter video ads.
- Video Orientation: iOS users are more likely to watch videos in landscape mode, while Android users are more likely to watch videos in portrait mode.
- Call-to-Action: iOS users are more likely to engage with a call-to-action at the end of a video ad, while Android users are more likely to engage with a call-to-action at the beginning of a video ad.
Video ad trends across different app verticals
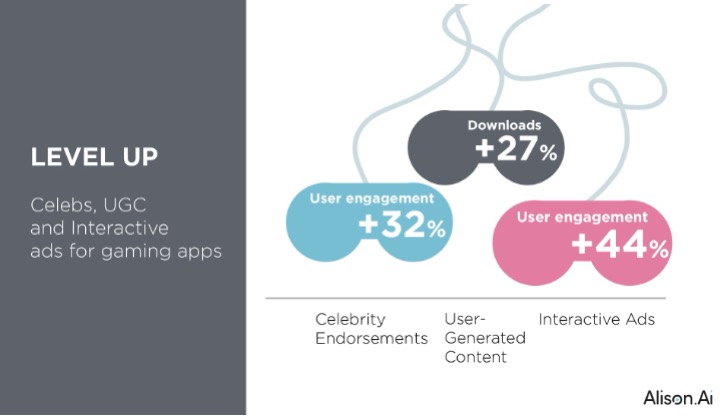
Games level up: celebs, UGC, and interactive ads
- Celebrity Endorsements: Many game apps are leveraging the power of celebrity endorsements in their video ads. Game developers are featuring well-known personalities to attract a wider audience and increase user engagement by 32%.
- User-Generated Content: Game developers are using user-generated content to showcase gameplay, share strategies, and create a community around the game. User-generated video ads have become an effective way to increase user engagement and drive a 27% lift in downloads.
- Interactive Ads: Interactive video ads that allow users to play a mini-game or try a sample level are becoming popular in the gaming vertical. These ads create an immersive experience that captures users’ attention and can lead to 44% higher engagement rates.
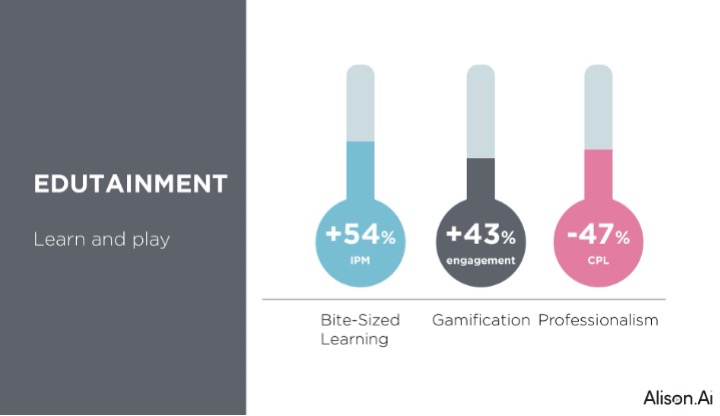
Education vertical: edutainment—learn and play
- Bite-Sized Learning: Education apps are creating video ads that emphasize their app’s ability to deliver bite-sized, on-demand learning. These ads highlight the convenience and flexibility of the app’s learning platform and improve IPM by 54%
- Gamification: Education apps are integrating gamification into their video ads to create an engaging and interactive experience. These ads showcase how the app can make learning fun and engaging for users, improving engagement rates by 43%.
- Professionalism: Education apps are creating video ads that emphasize their app’s professionalism and credibility. Advertisers are showcasing their app’s high-quality content, expert instructors, and professional certification programs to attract more registrations, lowering the CPL by 47%.
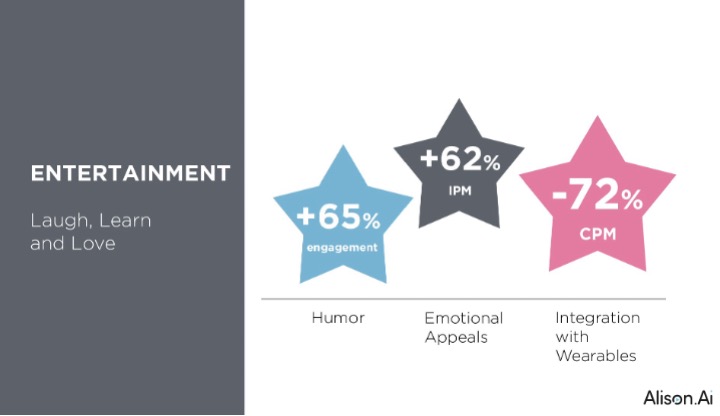
Entertainment: laugh, learn, and love
- Humor: Brands are using humor in video ads to create more memorable ads that are more likely to generate a higher engagement rate with a 65% lift.
- Behind-the-Scenes: Brands are using behind-the-scenes footage in video ads to create a sense of exclusivity, and behind-the-scenes access for their audience helps drive a 62% lift in IPM.
- High-Production Value Ads: Entertainment apps are investing in high-quality, visually stunning video ads that capture users’ attention, create a lasting impression, and drop CPM by 72%.
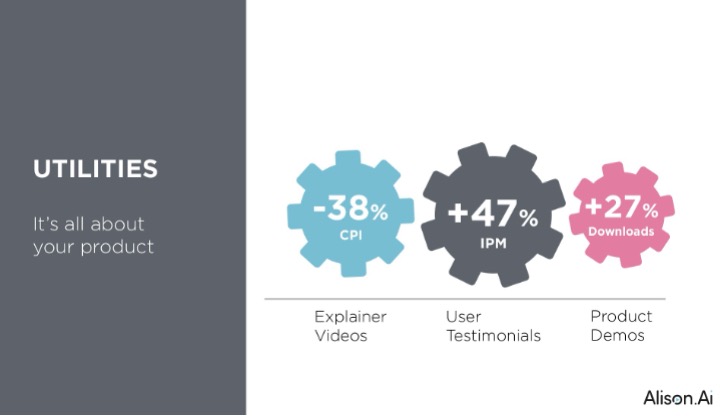
Utilities: it’s all about your product
- Explainer Videos: Brands are using explainer videos to showcase the features of their apps and how they can help users manage their tasks more efficiently, which has generated a drop of 38% in CPI
- User Testimonials: Brands are using user testimonials in video ads to increase trust and credibility among their audience, generating a lift of 47% in IPM
- User-generated content: Brands are using UGC in video ads to showcase how their app works and how it can benefit users, which has generated a lift of 27% in app downloads
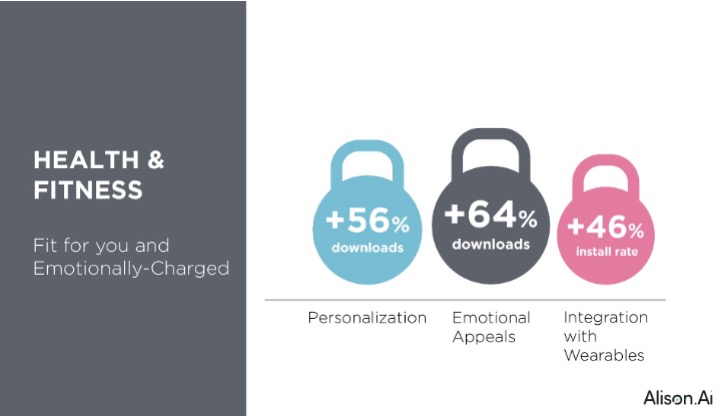
Health & Fitness: personalized and emotionally charged
- Personalization: Like utility apps, health and fitness apps are creating personalized video ads that speak to users’ individual needs and interests. Advertisers are leveraging data to create targeted, customized video ads that resonate with users and drive a 56% lift in downloads.
- Emotional Appeals: Health and fitness apps are using emotional appeals in their video ads to create a sense of urgency and motivate users to take action. Advertisers are using testimonials and success stories to demonstrate the app’s effectiveness and encourage users to download with a 64% lift.
- Integration with Wearables: Health and fitness apps are leveraging the popularity of wearable devices in their video ads. Advertisers are showcasing how their apps can work seamlessly with wearables to help users achieve their fitness goals. Using this approach generates a 46% higher install rate.
Summary:
Video advertising continues to evolve and adapt to changing consumer behaviors and interests. The trends discussed in this report can help brands and marketers create engaging and effective video ad content across various platforms and app verticals. Personalization, authenticity, and creativity are key factors in creating successful video ad campaigns. By keeping up with the latest video ad trends, brands can stay relevant and connected with their target audience.
Splitmetrics: Apple Search Ads CPT, CVR, and CPA
According to data from SplitMetrics Acquire, the first half of 2024 saw an average conversion rate of 61.36% across all placements in Apple Search Ads, including search results, Today tab, Search tab and product pages ads.
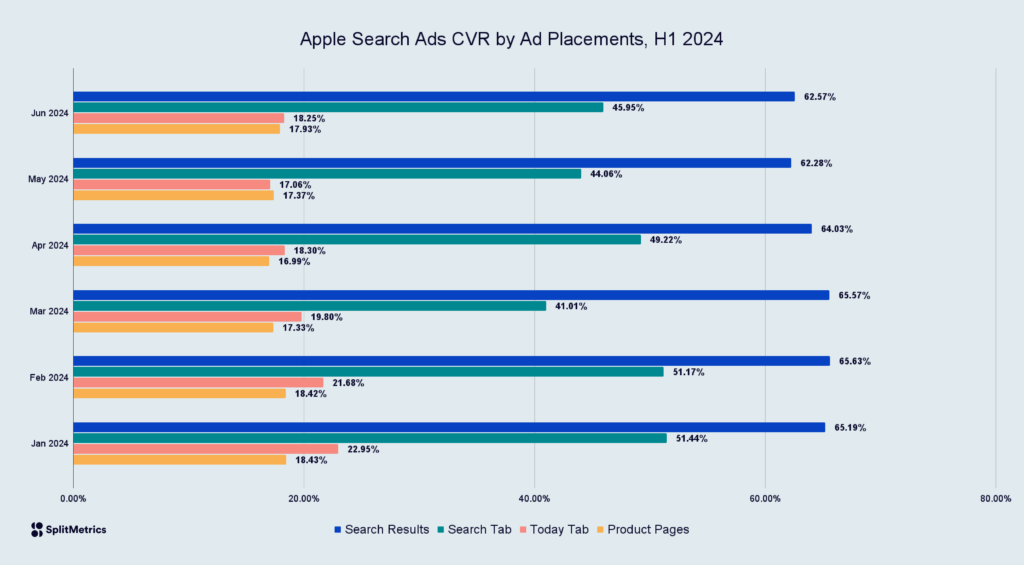
The average cost per tap (CPT) for search results ads was $1.37, and $1.36 for all placements in Apple Search Ads.
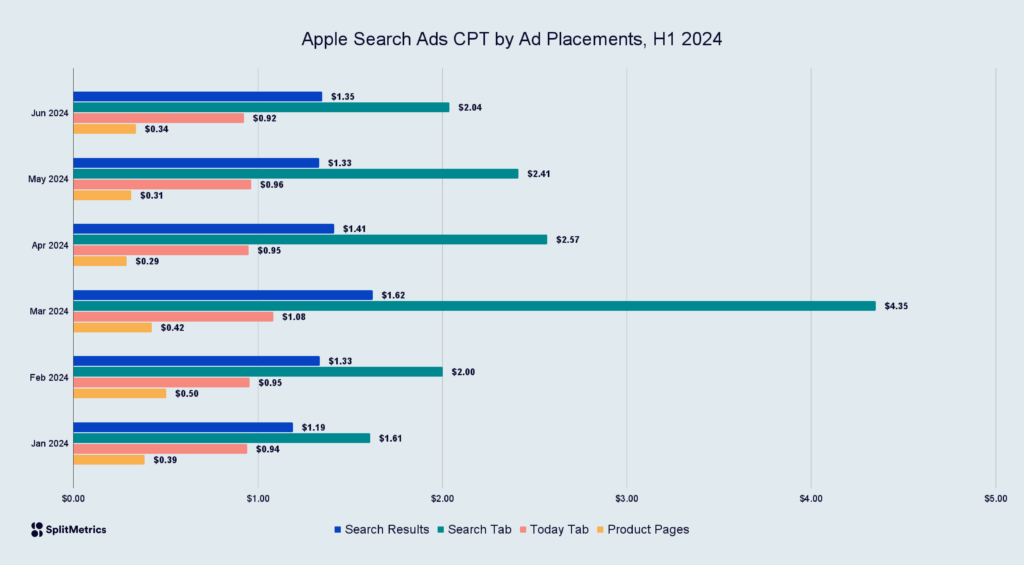
Cost per acquisition (CPA) in Q1 and Q2 of this year was $2.22 for all placements and $2.14 for search results campaigns.
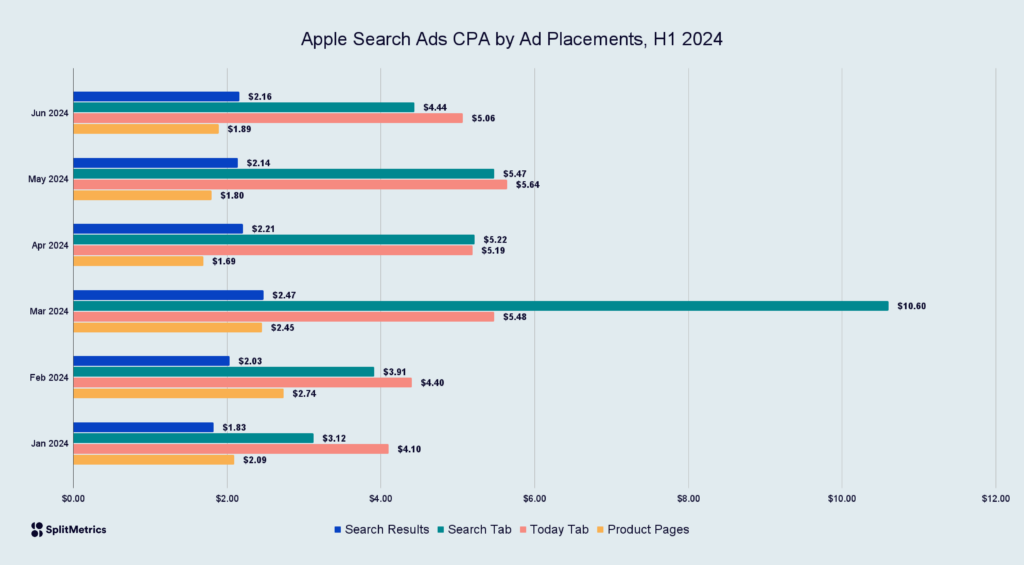
As we expect further adoption of other placements in Apple Search Ads, we anticipate conversion rates will continue to grow and CPT/CPA will move towards optimum values. We highly recommend running ad campaigns in multiple placements on the App Store in order to expand reach, visibility for your app, and target users with different intents and at various stages of their journey.
By leveraging multiplacement ad strategy in Apple Search Ads, you can ultimately improve overall performance, grow conversion, and optimize ROAS.
Persona.ly: hybrid monetization by age and gender
The mobile gaming vertical continues to expand, with more apps utilizing hybrid monetization models—combining both in-app purchases (IAP) and in-app advertising (IAA)—showing the highest growth rates.
Our analysis of 50+ games with hybrid monetization has revealed that alongside the obvious impact of device characteristics, the user’s age and gender play significant roles in the success of user acquisition campaigns.
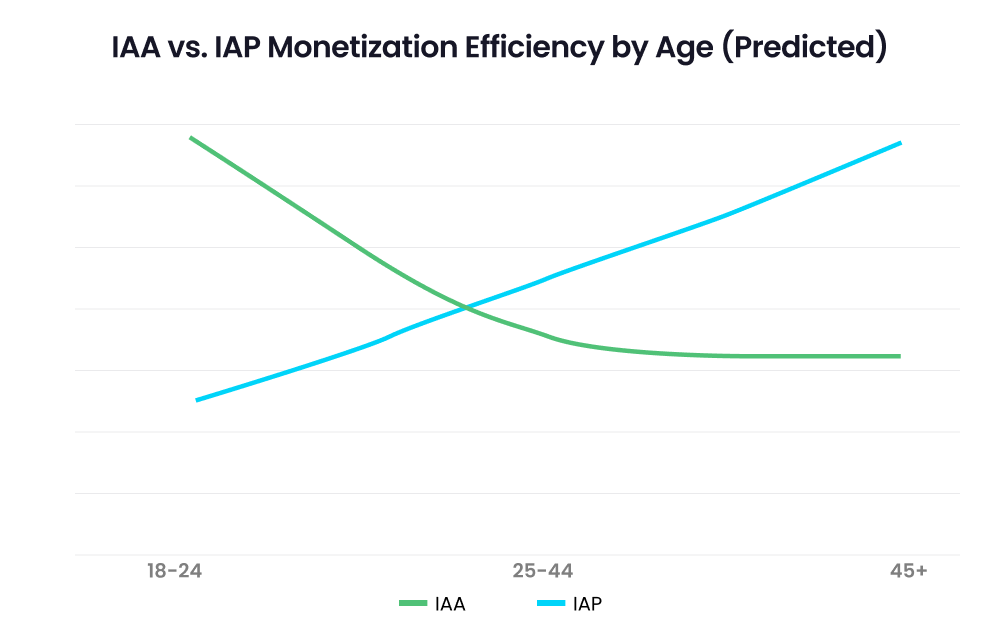
Key findings: age effects
- Younger players (18-24) tend to engage more but spend less.
- Middle-aged players (25-44) generally have the highest monetization potential as they both might watch ads to gain in-game perks, and make in-app purchases.
- Older players (45+) may spend more per transaction but make purchases less frequently.
The chart below shows the dynamics of ad. frequencies vs. IAP conversion rates according to the three different age groups we classify:
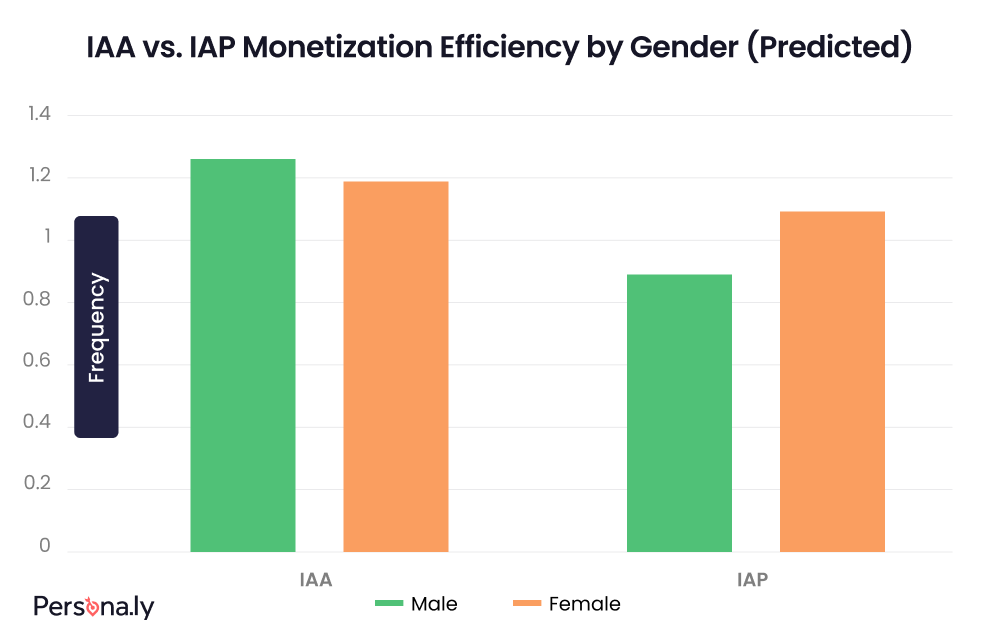
Key findings: gender effects
- Male players typically spend more on average, particularly in competitive genres.
- Female players often show higher engagement and retention rates.
- The spending gap between genders is narrowing in many game categories.
The chart below shows the dynamics of ad. frequencies vs. IAP conversion rates according our gender classification:
Key takeaways
In developing games with hybrid monetization strategies, a thorough understanding of user personas is critical for reaching positive ROI and being able to scale successfully. The age demographics of the targ
et audience significantly influence monetization potential and should be a key consideration in game design. This demographic insight should inform decisions on ad frequency and the implementation of IAP features to maximize user engagement and revenue.
Moreover, audience age demographics have a direct impact on the CPM rates obtained from advertisers, further underscoring the importance of age-targeted design and UA.
While the monetization gap between genders is narrowing, it remains a relevant factor in game design and monetization strategy. Developers should continue to account for gender differences when crafting games with hybrid monetization models to ensure optimal revenue generation.
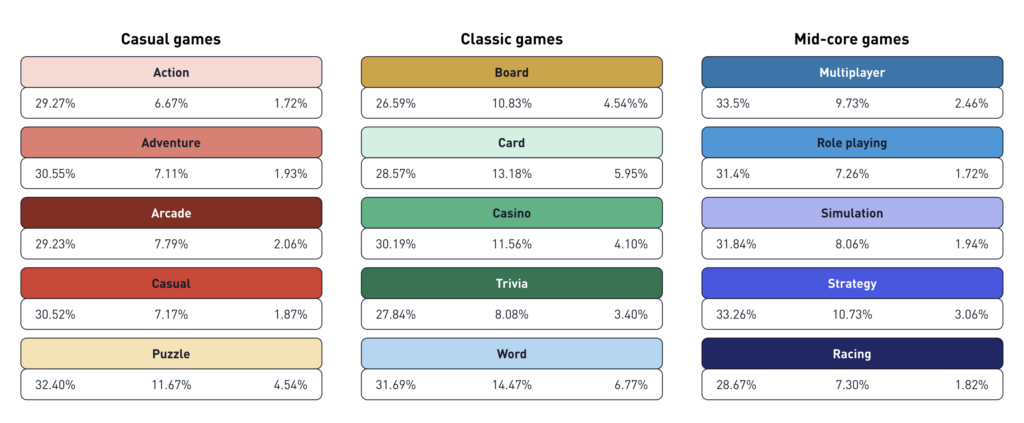
Mobvista: global game retention
Retention tracks the number of players who continue to engage with the game over time, in the case of this report measured at day 1, day 7, and day 28 after install. High retention rates mean players found the game compelling and were likely return. On the other hand, low retention rates suggest issues with gameplay, onboarding, or overall user experience.
Explore the retention rates of the top 25% of games across various regions, including North America, Europe, the Middle East, and Asia.
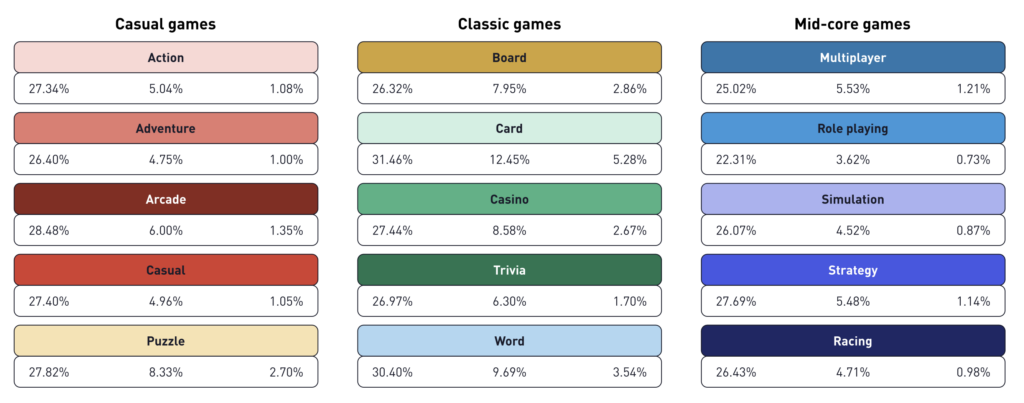
North America
North America boasts the highest day 1 retention in mid-core titles, with an average of 31.7% for the genre. This is buoyed by particularly strong day 1 retention for multiplayer games. Remarkably, retention in mid-core games is also the highest when comparing to other regions.
The first number is D1, second is D7, and third is D28:
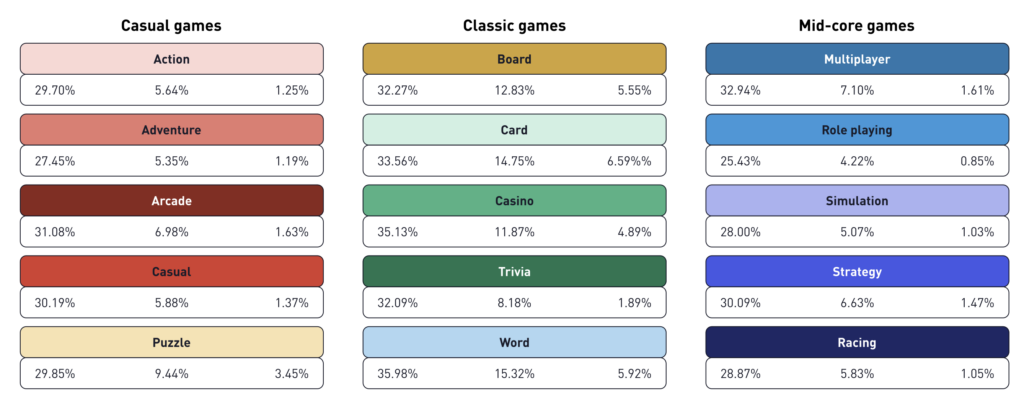
Europe
In Europe, casual games boast the highest retention at 31.79%. Adventure games display high day 1 retention but lag on day 7. Additionally, this region ties North America for top puzzle day 1 retention. It also leads in word games with 34% day 1 retention and tops simulation and racing games rates.
The first number is D1, second is D7, and third is D28:

Middle East
In the Middle East, classic games boast the highest day 1, day 7, and day 28 retention rates across all regions. Classic games also outperform casual and mid-core games within the region. This is mainly driven by word and casino games, although all sub-genres exhibit high or good retention rates. While other categories aren’t low performing, they lag behind North America and Europe.
The first number is D1, second is D7, and third is D28:
Asia
In Asia, there’s a general trend of the lowest performance when comparing to other genres across monitored regions. However, classic games stand out as the best performers in this region, particularly card games.