$1.5B in ad spend shows iOS 14.5 is driving mobile ad spend to Android
iOS ad spend is now down 32% from its peak in 2021.
In early February, mobile advertisers that have both an Android and iOS app split their buying almost evenly between Android and iOS. Between February 2 to 7, marketers spent 56.16% of their budgets on Android app install campaigns and 43.84% on iOS.
But last week, from June 14 to June 20, the split was 70.29% to 29.71%.
That’s a massive difference in just four months.
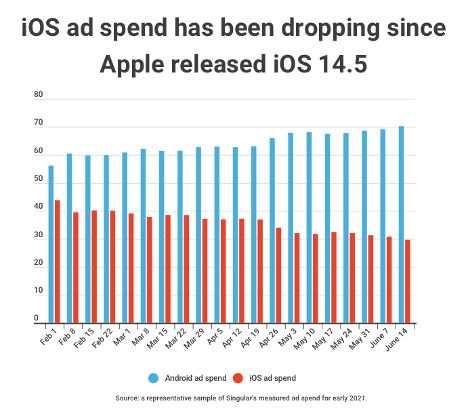
Digging into the data: iOS vs Android ad spend since iOS 14.5
There are some explanations to make and a few caveats to mention here.
The chart above is a representative sample of Singular’s global ad spend data totalling more than $1.5 billion from February to June 20. All of the sample spend is from customers who have both an Android and iOS app.
Is this all due to iOS 14.5?
Probably.
But is the iOS ad spend situation as bad as the numbers look?
Probably not quite, no.
But it is significant. We haven’t seen this kind of Android vs iOS shift in recent years, so this appears to be a real event that’s actually reflecting a shift by mobile app install ad buyers globally. However, it’s very important to note that part of this apparently massive iOS to Android shift is likely due to artificially inflated iOS spend in the weeks and months before Apple released iOS 14.5. As we know, iOS 14.5 took away a guaranteed advertising identifier while making marketing measurement harder and user data more scarce. So part of the big numbers in iOS ad spend in February and March was likely pre-buying: purchasing ad inventory in the last days of the free IDFA before Apple’s iOS 14.5 came and made the identifier for advertisers an advertiser ask and a user opt-in.
So some of this massive decrease is likely illusory.
But not all of it.
Case in point: the mobile ad spend numbers after April 26 tell a similar story.
April 26, of course, is when Apple released iOS 14.5. In almost every week since then, the percentage of total ad spend that advertisers directed to iOS has dropped, while Android keeps rising. The week before iOS 14.5 dropped, iOS ad spend was 37% of total spend on Android and iOS combined. The week after, it was 32%, and except for a minor bump in the week of May 17, the downward trajectory has continued until last week, ending (for now) on June 20 at 29.71%.
It’s not just the percentage of iOS ad spend as a proportion of all mobile app install ad spend that’s dropping.
It’s also the actual spend totals.
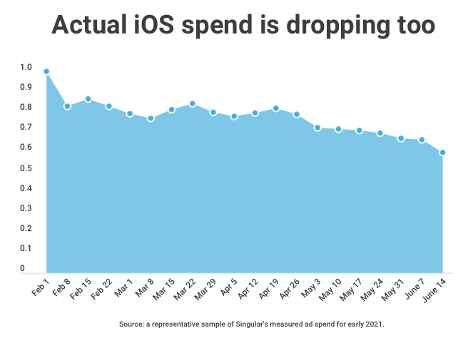
If we normalize February 1-7’s ad spend as 100%, June 14 is 59.8% of that. If we agree that the early February data is an outlier and prefer to look at February 15, the June 14-20 data is still 26 percentage points lower: 86% of early February’s spend to basically 60%.
Correlation isn’t causation, right?
But … there’s something else that has been happening at the same time.
iOS 14.5 adoption hit the turbo button
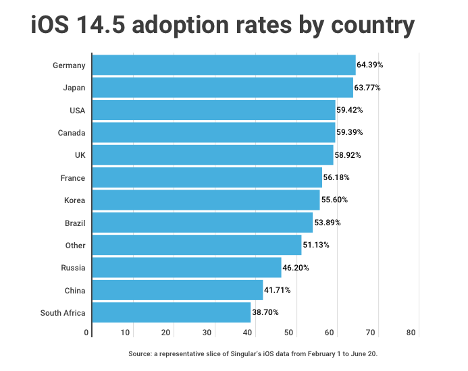
Right after May 30, Apple flipped a switch and started informing iOS users that there was an upgrade available. Adoption rates, which had been slow, immediately picked up. By June 17, the latest data I have, 52% of global iPhone owners have updated their devices to iOS 14.5.
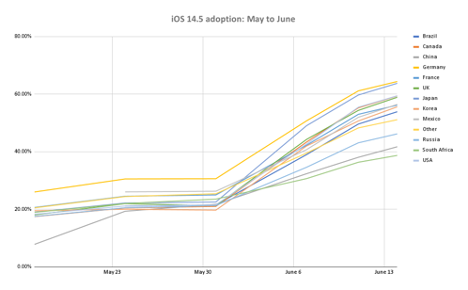
Germany leads the pack with almost two thirds having updated their devices, while South Africa is just shy of two fifths. After a slow start, Chinese users have rapidly accelerated their updates.
If there’s a causal relationship between availability of ad identifiers and ad spend focus, the ad spend percentage between Android and iOS is likely to continue to change in Android’s favor. If this is a temporary phenomenon until advertisers rejig their growth stacks for SKAdNetwork and non-fingerprinting probabilistic measures of advertising effectiveness, the iOS ad spend percentage could rebound.
Time, as they say, will tell.
And … App Tracking Transparency opt-in rates?
ATT rates haven’t really changed through the iOS 14.5 adoption curve.
On May 21, when iOS 14.5 adoption was under 20% globally, ATT-restricted devices were at 19% and opt-in rates were at 19.4%. On June 4, that was only up to 24.3% globally, and opt-in rates were up a hair to 19.7%.
As of last week, we’re at 23.64%. Note: that means 23.64% of the time when iOS apps requested App Tracking Transparency authorization, they get it. More than three quarters of the time, however, they do not. As many others have written about, thanks to the dual-opt-in necessity of marketing measurement in iOS 14.5 (advertised app and ad-displaying app) these numbers mean that unless your app is an extreme outlier, the IDFA is essentially useless for what it once was: the definitive provider of attribution truth.
(One caveat here: even if your dual opt-in rate is only 10% or so, if you find that your ATT opt-in users are representative of your ATT opt-out users, you might be able to cautiously make some optimization inferences.)
Interestingly, some countries are significant outliers here:
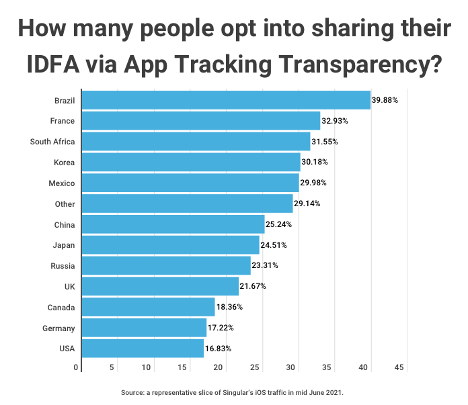
While the global rate is edging up as late adopters start to update their iPhones and iPads, regional differences are much more significant. In Brazil, almost 40% of people opt-in to tracking; in the USA, where Apple has advertised heavily about its privacy enhancements, the rate is significantly lower: 16.8%.
Subscribe for insights by mail
We’ll be updating these numbers soon, and adding more insights on different aspects of SKAdNetwork. If you don’t want to miss any, you may want to sign up for Singular’s content email newsletter.
Scroll down on the blog home page to find the “Stay up to date” sign-up spot. Then, when you get the first email, drag it into your priority mailbox to tell Gmail or whatever email app you use that it’s important.
We don’t spam. We do aim to provide a significant amount of insight and value. And we’re honored to be one of your sources of vital marketing ecosystem information.
Stay up to date on the latest happenings in digital marketing


